An insurance company selected 2000 drivers at random (i.e., without any preference of one driver over another) in a particular city to find a relationship between age and accidents . The data obtained are given in following table :
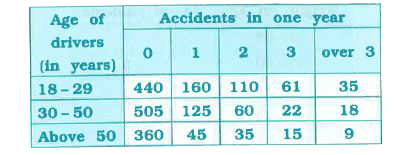
Find the probabilities of the following events for a driver chosen at random from the city.
having no accidents in one year
The correct Answer is:0.653
Step by step video & image solution for An insurance company selected 2000 drivers at random (i.e., without any preference of one driver over another) in a particular city to find a relationship between age and accidents . The data obtained are given in following table : Find the probabilities of the following events for a driver chosen at random from the city. having no accidents in one year by Maths experts to help you in doubts & scoring excellent marks in Class 9 exams.
Updated on:21/07/2023Topper's Solved these Questions
- PROBABILITY BOOK - NAVNEET PUBLICATION - MAHARASHTRA BOARDCHAPTER - PROBABILITY EXERCISE - Skill Testing Exercise
8 Videos
- PROBABILITY BOOK - NAVNEET PUBLICATION - MAHARASHTRA BOARDCHAPTER - PROBABILITY EXERCISE - EXERCISE 15.1
23 Videos
- LINE AND ANGLESBOOK - NAVNEET PUBLICATION - MAHARASHTRA BOARDCHAPTER - LINE AND ANGLESEXERCISE - Multiple Choice Questions MCQs)
10 Videos
- SURFACE AREAS AND VOLUMESBOOK - NAVNEET PUBLICATION - MAHARASHTRA BOARDCHAPTER - SURFACE AREAS AND VOLUMESEXERCISE - MULTIPLE CHOICE QUESTIONS
18 Videos
Similar Questions
An insurance company selected 2000 drivers at random (i.e., without any preference of one driver over another) in a particular city to find a relationship between age and accidents. The data obtained are given in the following table:

Find the probabilities of the following events for a driver chosen at random from the city:
(i) being 18-29 years of age and having exactly 3 accidents in one year.
(ii) being 30-50 years of age and having one or more accidents in a year.
(iii) having no accidents in one year
View SolutionAn insurance company selected 2000 drivers at random (i.e., without any preference of one driver over another) in a particular city to find a relationship between age and accidents . The data obtained are given in following table :
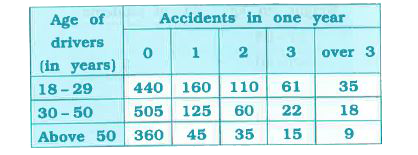
Find the probabilities of the following events for a driver chosen at random from the city.
being 18-29 years of age and having exactly 3 accidents in one year.
View SolutionAn insurance company selected 2000 drivers at random (i.e., without any preference of one driver over another) in a particular city to find a relationship between age and accidents . The data obtained are given in following table :
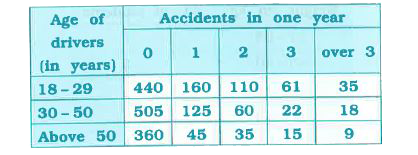
Find the probabilities of the following events for a driver chosen at random from the city.
being 30-50 years of age and having one or more accidents in a year.
View SolutionAn insurance company selected 2000 drivers at random in particular city to find a relationship between age and accidents . The data obtained are given in the following table .
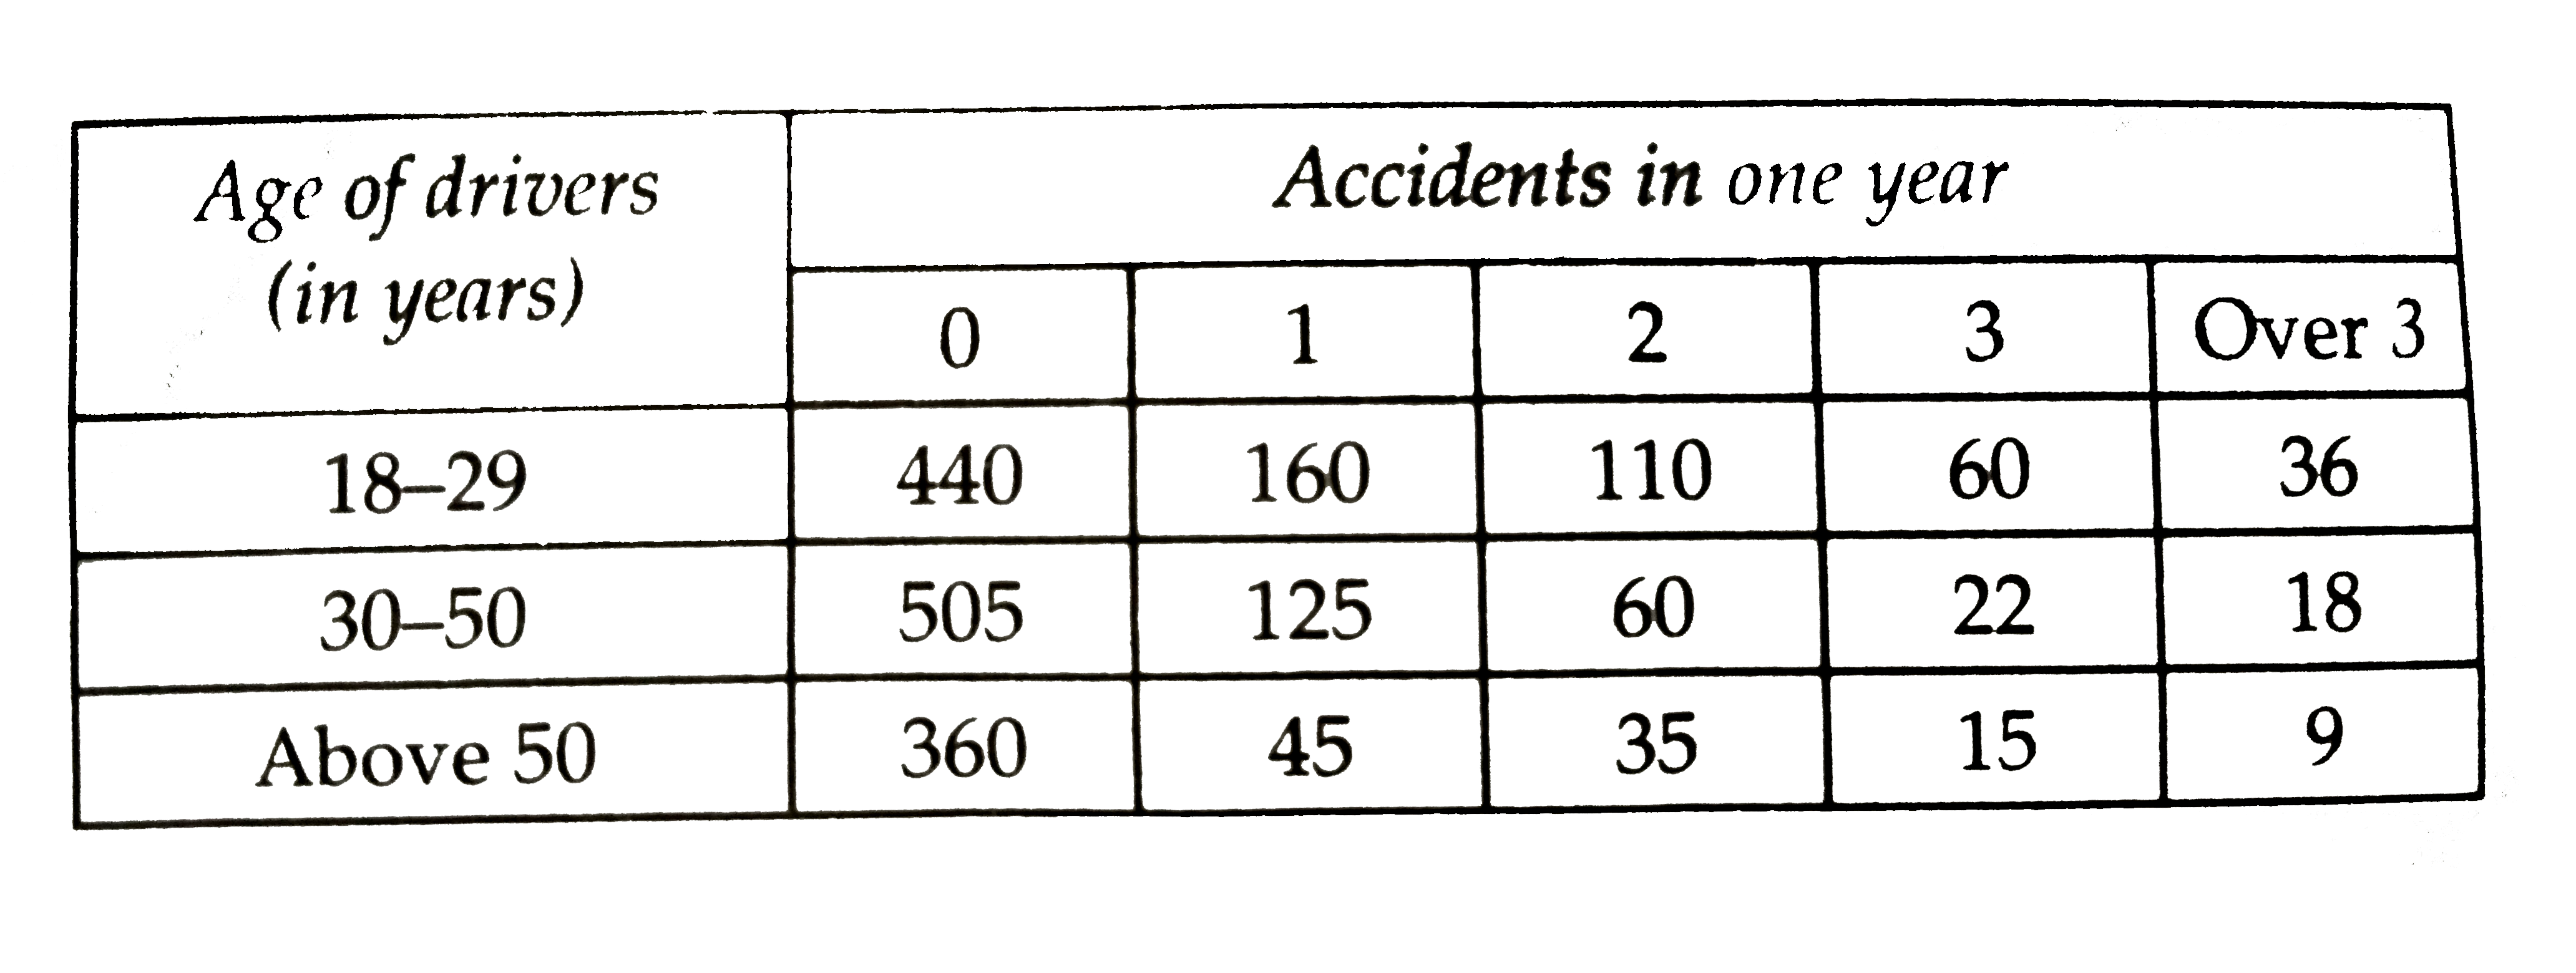
Find the probability of each of the following events for a driver chosen at random from the city :
(i) being 18−29 years of age and having exactly 3 accidents in one year .
(ii) being 30−50 years of age and having one or more accidents in one year
(iii) having no accident in one year .
View SolutionAn insurance company selected 2000 drivers at random in a particular city to find a relationship between age and accidents. The obtained are given in the following table: Age of Drivers (in years) Accidents in one year 0 1 2 3 over 3 18-29 30-50 above 50 440 505 360 160 125 45 110 60 35 61 22 15 35 18 9 Find the probability of the following events for a driver chosen at random from the life city: being 18-29 years of age and having exactly 3 accidents in one year. being 30-50 years of age and having one or more accidents in a year. having no accidents in one year.
View SolutionA selection committee of school selected 2000 girls for scholarship of different age. The data obtained are given in the following table:
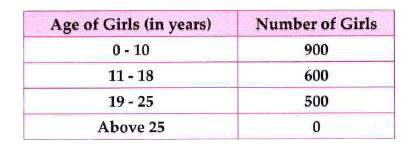
Find the probabilities of the girls selected for scholarship in following age group.
11 - 18
View SolutionA selection committee of school selected 2000 girls for scholarship of different age. The data obtained are given in the following table:
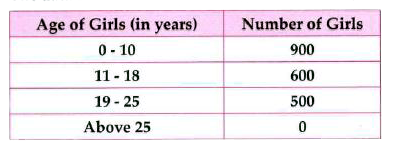
Find the probabilities of the girls selected for scholarship in following age group.
0 - 18
View SolutionA company selected 4000 households at random and surveyed them to find out a relationship between income level and the number of televisions sets in a home. The information, so obtained is listed in the following table.
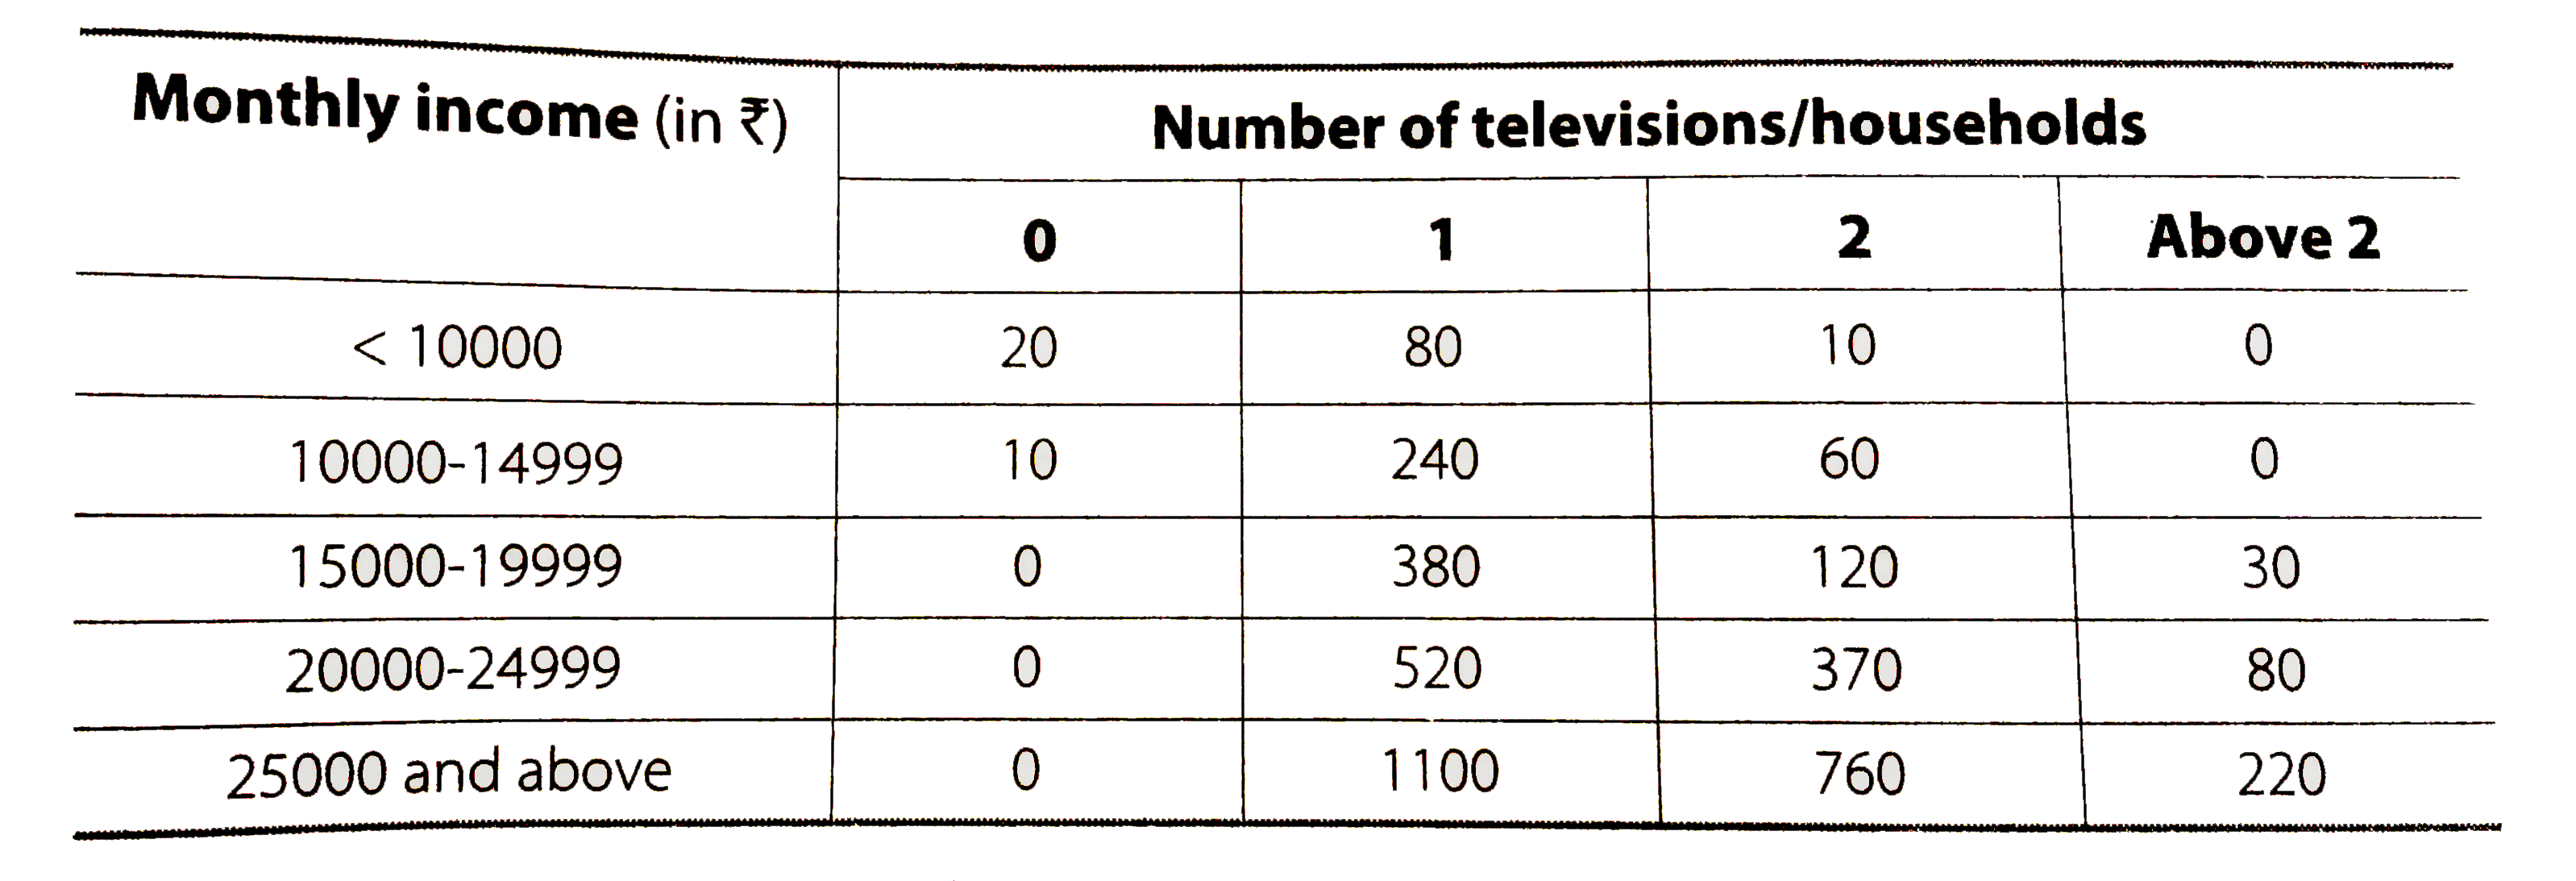
Find the probability
i) of a household earning Rs 10000- Rs 14999 per year and having exactly one television.
ii) of a household earning Rs 25000 and more per year owning 2 televisions.
iii) of a household not having any television.
View SolutionA company selected 2300 families at random and surveyed them to determine a relationship between income level and the number of vehicles in a home The information gathered is listed in the table below : if a family is chosen at random, find the probability that the family is: (i) earning Rs.7000-13000 per month and owning exactly 1 vehicle (ii) owning not more than one vehicles. more than 2 vehicles (lii) earning more than Rs. 13000 and owning 2 or (iv) owning no vehicle
View SolutionAn organisation selected 2400 families at random and surveyed them to determine relationship between income level and the number of vechicles in a family. The information gathered is listed in the table below:

Suppose a family is chosen. Find the probability that the family chosen is :
(i) earning Rs. 10000-13000 per month and owning exactly 2 vehicles.
(ii) earning Rs. 16000 or more per month and owning exactly 1 vehicle.
(iii) earning less than Rs. 7000 per month and does not own any vehicle.
(iv) earning Rs. 13000-16000 per month and owning more than 2 vehicles.
(v) owning not more than 1 vehicle.
View Solution
