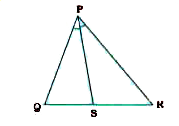
In the given figure, PR > PQ and PS bisects ∠ QPR. Prove that ∠PSR>∠PSQ.
 Solution in Gujrati
The correct Answer is:∠PSR>∠PSQ
Step by step video, text & image solution for In the given figure, PR gt PQ and PS bisects angle QPR. Prove that angle PSR gt angle PSQ. by Maths experts to help you in doubts & scoring excellent marks in Class 9 exams.
Topper's Solved these Questions
- BOOK - KUMAR PRAKASHANCHAPTER - TRIANGLESEXERCISE - EXERCISE 7.54videos
TRIANGLES
- BOOK - KUMAR PRAKASHANCHAPTER - TRIANGLESEXERCISE - SKILL TESTING EXERCISE20videos
TRIANGLES
- BOOK - KUMAR PRAKASHANCHAPTER - TRIANGLESEXERCISE - EXERCISE 7.35videos
TRIANGLES
- BOOK - KUMAR PRAKASHANCHAPTER - SURFACE AREAS AND VOLUMESEXERCISE - MULTIPLE CHOICE QUESTIONS18videos
SURFACE AREAS AND VOLUMES
Similar Questions
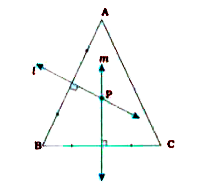
ABC is a triangle. Locate a point in the interior of △ ABC which is equidistant from all the vertices of △ ABC
 02:11View Solution
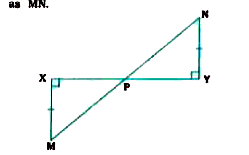
In the given figure, XM and YN are both < perpendicular to line segment XY and XM = YN. 4 Prove that P is the midpoint of XY as well as MN
 01:31View Solution
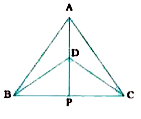
△ ABC and △ DBC are two isosceles triangles on the same base BC and vertices A and D are on the same side of BC (see the given figure). If AD is extended to intersect BC at P, show that, ( i ) △ABD=△ACD(ii)△ABP=△ACP (iii) AP bisects ∠ A as well as ∠ D. (iv) AP is the perpendicular bisector of BC
 02:03View Solution
The total surface area of a cuboid with length 20 cm, breadth 15 cm and height 10 cm is ……… cm2.
02:45View SolutionDetermine the point of symmetry of a regular hexagon.
02:17View SolutionDtermine the images of the following figure about the given line :
05:41View SolutionIn the given figure, AB is a diameter, O is the center of the circle and ∠OCB=50∘ then find ∠DBC.
02:21View SolutionMatch the following Column A to Column B
 02:03View Solution
Match the following Column A to Column B
 02:10View Solution
Match the following Column A to Column B
 02:17View Solution
Find the area of the figure given below.
 02:10View Solution
The area of the shaded part in the figure given below is ______.
 04:23View Solution
The inequation represented by the graph given below is :
03:37View SolutionThe inequation that best describes the graph given below is _________
04:13View SolutionThe inequation that best describes the following graph is _________
04:09View SolutionWhich inequations represent the shaded region in the given figure
01:52View Solution

