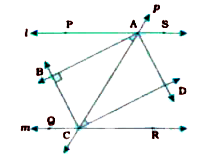
Two parallel lines l and m are intersected by a transversal p (see the given figure). Show that the quadrilateral formed by the bisector of interior angles is a rectangle.
 Solution in Gujrati
Step by step video & image solution for Two parallel lines l and m are intersected by a transversal p (see the given figure). Show that the quadrilateral formed by the bisector of interior angles is a rectangle. by Maths experts to help you in doubts & scoring excellent marks in Class 9 exams.
Updated on:21/07/2023Topper's Solved these Questions
- QUADRILATERALSBOOK - KUMAR PRAKASHANCHAPTER - QUADRILATERALSEXERCISE - EXERCISE 8.1
13 Videos
- QUADRILATERALSBOOK - KUMAR PRAKASHANCHAPTER - QUADRILATERALSEXERCISE - SKILL TESTING EXERCISE
14 Videos
- PROBABILITY BOOK - KUMAR PRAKASHANCHAPTER - PROBABILITY EXERCISE - Multiple Choice Questions (MCQs)
10 Videos
- QUESTION PAPER 2: FOR THE SECOND TESTBOOK - KUMAR PRAKASHANCHAPTER - QUESTION PAPER 2: FOR THE SECOND TESTEXERCISE - SECTION D (Solve the following :)
5 Videos
Similar Questions
The angles of a quadrilateral are in the ratio 3:5:9:13. Find all the angles of quadrilateral.
View SolutionProve that each diagonal of a parallelogram divides it into two congruent triangles.
View SolutionWhen a balanced die is thrown, the porbability of getting 3 , is .......
View SolutionLocate √3 on number line
View SolutionHow many lines of symmetry does the above figure have ?
View SolutionDetermine the point of symmetry of a regular hexagon.
View SolutionDtermine the images of the following figure about the given line :
View SolutionMatch the following Column A to Column B

View SolutionMatch the following Column A to Column B

View SolutionMatch the following Column A to Column B

View SolutionFind the area of figure given below.

View SolutionFind the perimeter of the figure given below.

View SolutionFind the area of the figure given below.

View SolutionThe area of the shaded part in the figure given below is ______.

View SolutionThe inequation represented by the graph given below is :
View SolutionThe inequation that best describes the graph given below is _________
View Solution
