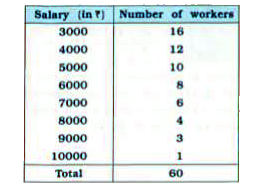
Find the mean salary of 60 workers of a factory from the following table :
 Solution in Gujrati
Step by step video & image solution for Find the mean salary of 60 workers of a factory from the following table : by Maths experts to help you in doubts & scoring excellent marks in Class 9 exams.
Updated on:21/07/2023Topper's Solved these Questions
- STATISTICSBOOK - KUMAR PRAKASHANCHAPTER - STATISTICSEXERCISE - SUM TO ENRICH REMEMBER
14 Videos
- STATISTICSBOOK - KUMAR PRAKASHANCHAPTER - STATISTICSEXERCISE - SKILL TESTING EXERCISE
21 Videos
- STATISTICSBOOK - KUMAR PRAKASHANCHAPTER - STATISTICSEXERCISE - EXERCISE 14.3
9 Videos
- QUESTION PAPER 3 : FOR THE ANNUAL EXAMINATION BOOK - KUMAR PRAKASHANCHAPTER - QUESTION PAPER 3 : FOR THE ANNUAL EXAMINATION EXERCISE - SECTION -D
5 Videos
- SURFACE AREAS AND VOLUMESBOOK - KUMAR PRAKASHANCHAPTER - SURFACE AREAS AND VOLUMESEXERCISE - MULTIPLE CHOICE QUESTIONS
18 Videos
Similar Questions
Consider the marks obtained by 10 students in a mathematics test as given below: 55 36 95 73 60 42 25 78 75 62 Find the range of the data.
View SolutionThe marks scored by 40 students in a Mathematics test are given below:

Prepare the frequency distribution with classes 0-4, 5-9.....
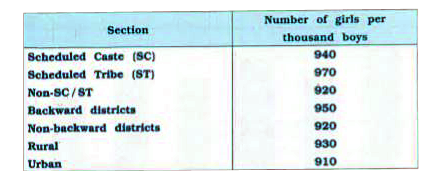
View SolutionThe following data on the number of girls (to the nearest ten) per thousand boys in different sections of Indian society is given below:

(i) Represent the information above by a bar graph. (ii) In the classroom discuss what conclusions can be arrived at from the graph.
View SolutionProve that the angles opposite to equal sides of an isosceles triangle are equal.
View SolutionThe total surface area of a cuboid with length 20 cm, breadth 15 cm and height 10 cm is ……… cm2.
View SolutionWhich of the following are correct chain isomers of butane ? (i)
View SolutionDetermine the point of symmetry of a regular hexagon.
View SolutionDtermine the images of the following figure about the given line :
View SolutionMatch the following Column A to Column B

View SolutionMatch the following Column A to Column B

View SolutionMatch the following Column A to Column B

View SolutionFind the area of figure given below.

View SolutionFind the perimeter of the figure given below.

View SolutionFind the area of the figure given below.

View SolutionThe inequation represented by the graph given below is :
View SolutionThe inequation that best describes the graph given below is _________
View Solution
