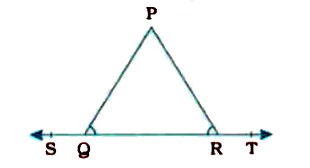
In the given figure, ∠PQR=∠PRQ, then prove that ∠PQS=∠PRT.
 Solution in Gujrati
Step by step video & image solution for In the given figure, anglePQR=anglePRQ, then prove that anglePQS=anglePRT. by Maths experts to help you in doubts & scoring excellent marks in Class 9 exams.
Updated on:21/07/2023Topper's Solved these Questions
- QUESTION PAPER 3 : FOR THE ANNUAL EXAMINATION Book:KUMAR PRAKASHANChapter:QUESTION PAPER 3 : FOR THE ANNUAL EXAMINATION Exercise:SECTION -D
Explore 5 Videos
- QUESTION PAPER 3 : FOR THE ANNUAL EXAMINATION Book:KUMAR PRAKASHANChapter:QUESTION PAPER 3 : FOR THE ANNUAL EXAMINATION Exercise:SECTION -B
Explore 13 Videos
- QUESTION PAPER 2: FOR THE SECOND TESTBook:KUMAR PRAKASHANChapter:QUESTION PAPER 2: FOR THE SECOND TESTExercise:SECTION D (Solve the following :)
Explore 5 Videos
- STATISTICSBook:KUMAR PRAKASHANChapter:STATISTICSExercise:MULTIPLE CHOICE QUESTIONS
Explore 12 Videos
Similar Questions
Prove that the angles opposite to equal sides of an isosceles triangle are equal.
View SolutionFind the surface area of a sphere of radius 7 cm.
View SolutionLocate √3 on number line
View SolutionThe marks scored by Kavya in 10 tests of Mathematics are 35. 18, 41, 24, 45, 10, 28, 32, 40, 15. Then, the range of the data is.......
View SolutionDetermine the point of symmetry of a regular hexagon.
View SolutionDtermine the images of the following figure about the given line :
View SolutionMatch the following Column A to Column B

View SolutionMatch the following Column A to Column B

View SolutionMatch the following Column A to Column B

View SolutionFind the area of figure given below.

View SolutionFind the area of the figure given below.

View SolutionThe area of the shaded part in the figure given below is ______.

View SolutionThe inequation represented by the graph given below is :
View SolutionThe inequation that best describes the graph given below is _________
View SolutionThe inequation that best describes the following graph is _________
View SolutionWhich inequations represent the shaded region in the given figure
View Solution
