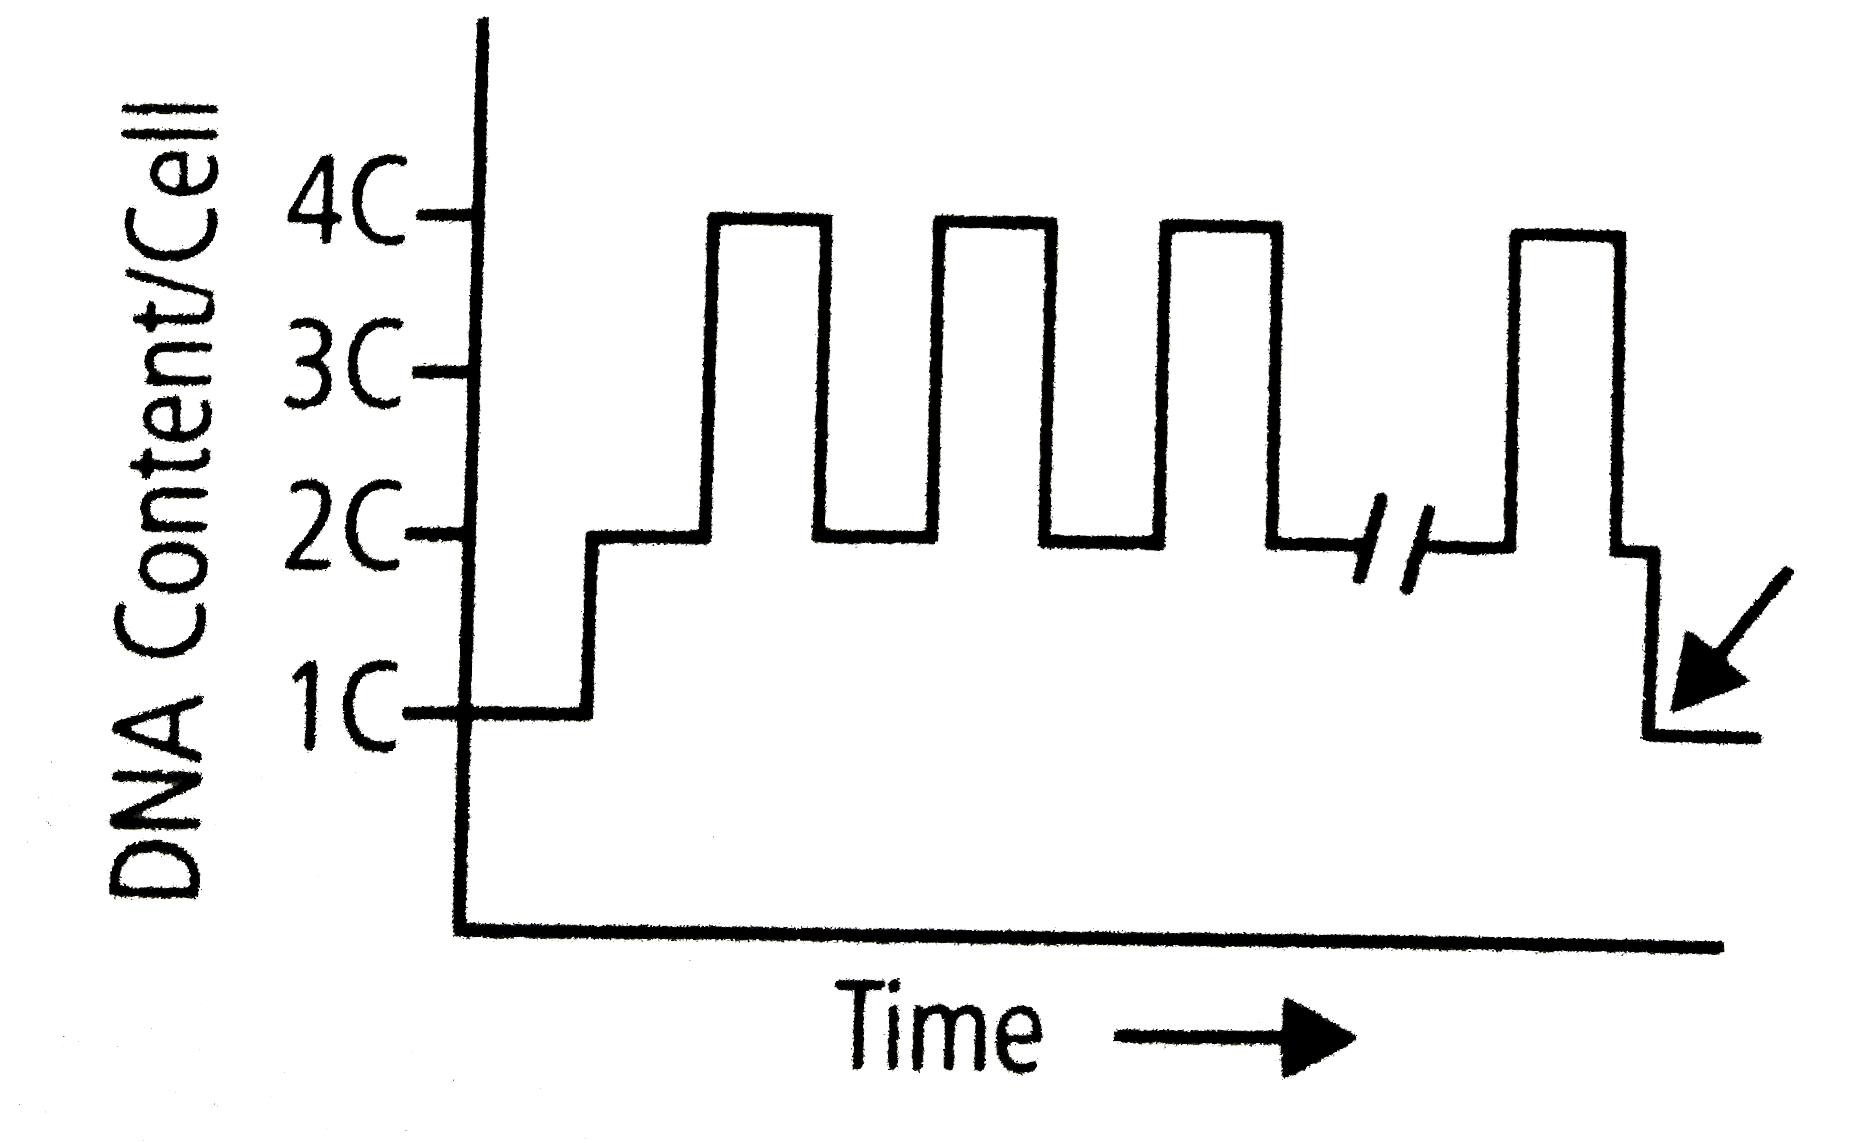
Given diagram shows variations in the amount of DNA of a developing eukaryote. What the arrow denotes?
First meiotic anaphase
Second meiotic anaphase
Mitotic anaphase
Mitotic telophase
The correct Answer is:B
The given graph shows variations in the DNA content in the cells of a eukaryote. Hploid set of chromosomes 1C is present in gamete which on fertilisation with gamete of opposite sex acquires diploid set of chormosomes (2C) and transforms into embryo embryo develops and grows into diplid organism by multiple mitotic divisions. During sexual reproduction gamete formation takes place by meiotic divison under which amount of DNA (2C) increases to 4C during S phase, which in first meiotic divison reduces to half i.e., 2C, divided among two daughter cells wheresas chormosomal number reduces to half i.e., from 2n to n. During second meiotic division, the amont of DNA is further distriuted equally from each daughter cells from first meiotic division ) to two daughter cells. The second meiotic division is equational, therefore the number of chromosome remains the same as produced at the end of meiosis I. Thus at the end of meiosis-II, each of the four haploid daughter cells contains one copy of every chromosme in the set (1C), rather two.
Topper's Solved these Questions
- BOOK - NCERT FINGERTPS ENGLISHCHAPTER - CELL CYCLE AND CELL DIVISIONEXERCISE - NCERT10videos
CELL CYCLE AND CELL DIVISION
- BOOK - NCERT FINGERTPS ENGLISHCHAPTER - CELL CYCLE AND CELL DIVISIONEXERCISE - CORNER15videos
CELL CYCLE AND CELL DIVISION
- BOOK - NCERT FINGERTPS ENGLISHCHAPTER - CELL CYCLE AND CELL DIVISIONEXERCISE - MITOSIS37videos
CELL CYCLE AND CELL DIVISION
- BOOK - NCERT FINGERTPS ENGLISHCHAPTER - CELL - THE UNIT OF LIFEEXERCISE - Cell - The Unit Of Life159videos
CELL - THE UNIT OF LIFE
- BOOK - NCERT FINGERTPS ENGLISHCHAPTER - CHEMICAL COORDINATION AND INTEGRATIONEXERCISE - All Questions126videos
CHEMICAL COORDINATION AND INTEGRATION
Similar Questions
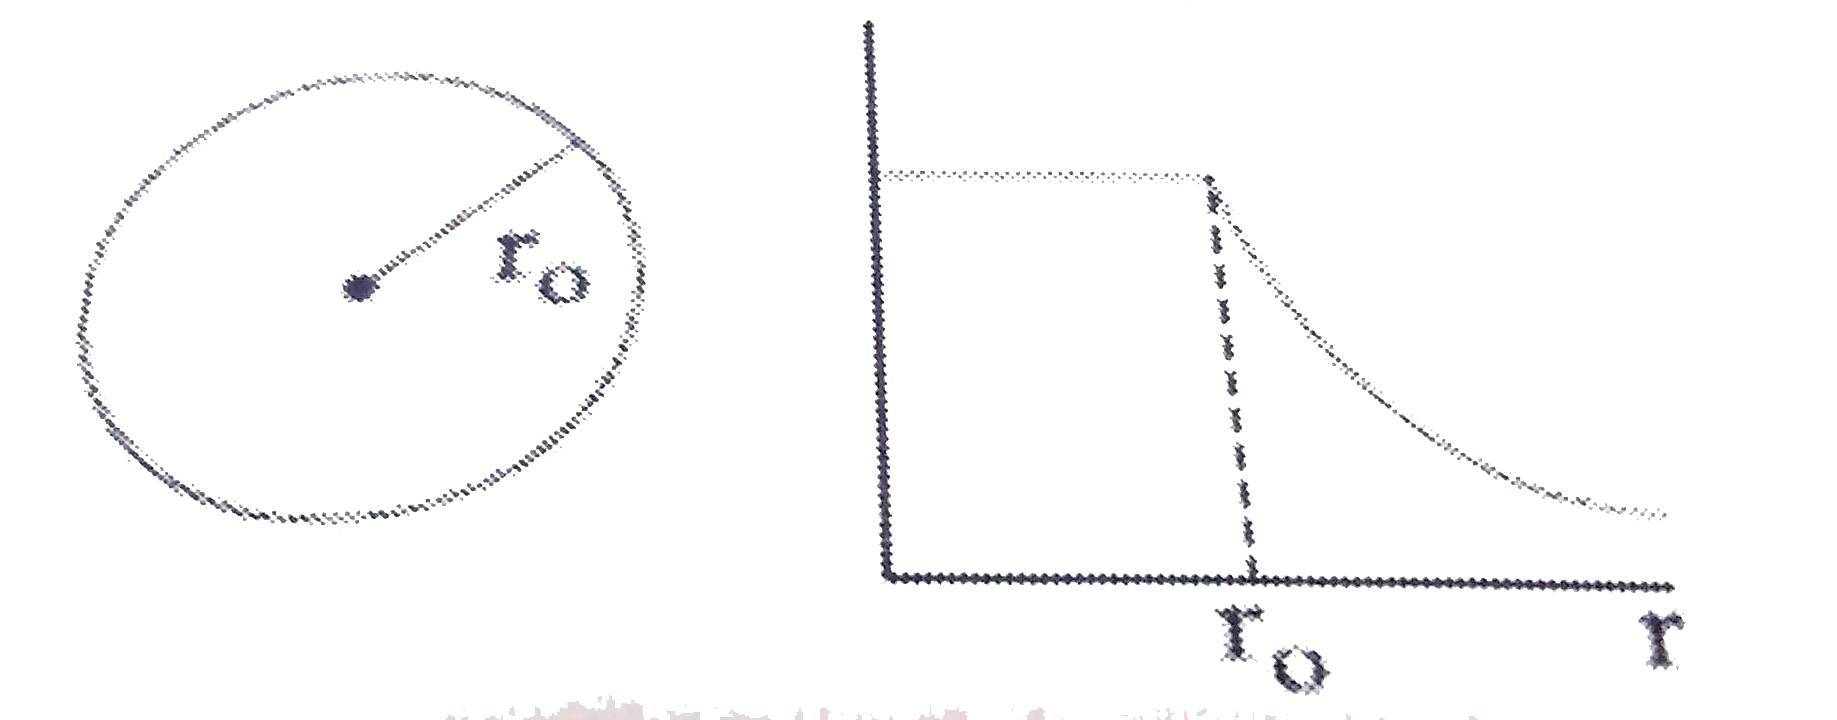
The given graph shows variation (with distance r form center) of :
 View Solution
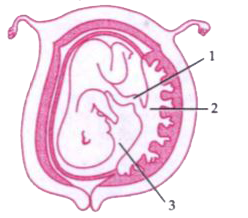
The diagram given below is that of a developing human foetus. Study the diagram and then answer the questions that follow :
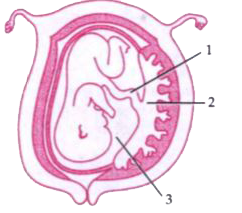
Define the term 'Gestation'. What is the normal gestational period of the developing human embryo ?View Solution
Knowledge Check
- Question 1 - Select One
Which of the following graphs shows the relative change in the amount of mitochondrial DNA of a cell undergoing mitosis?
A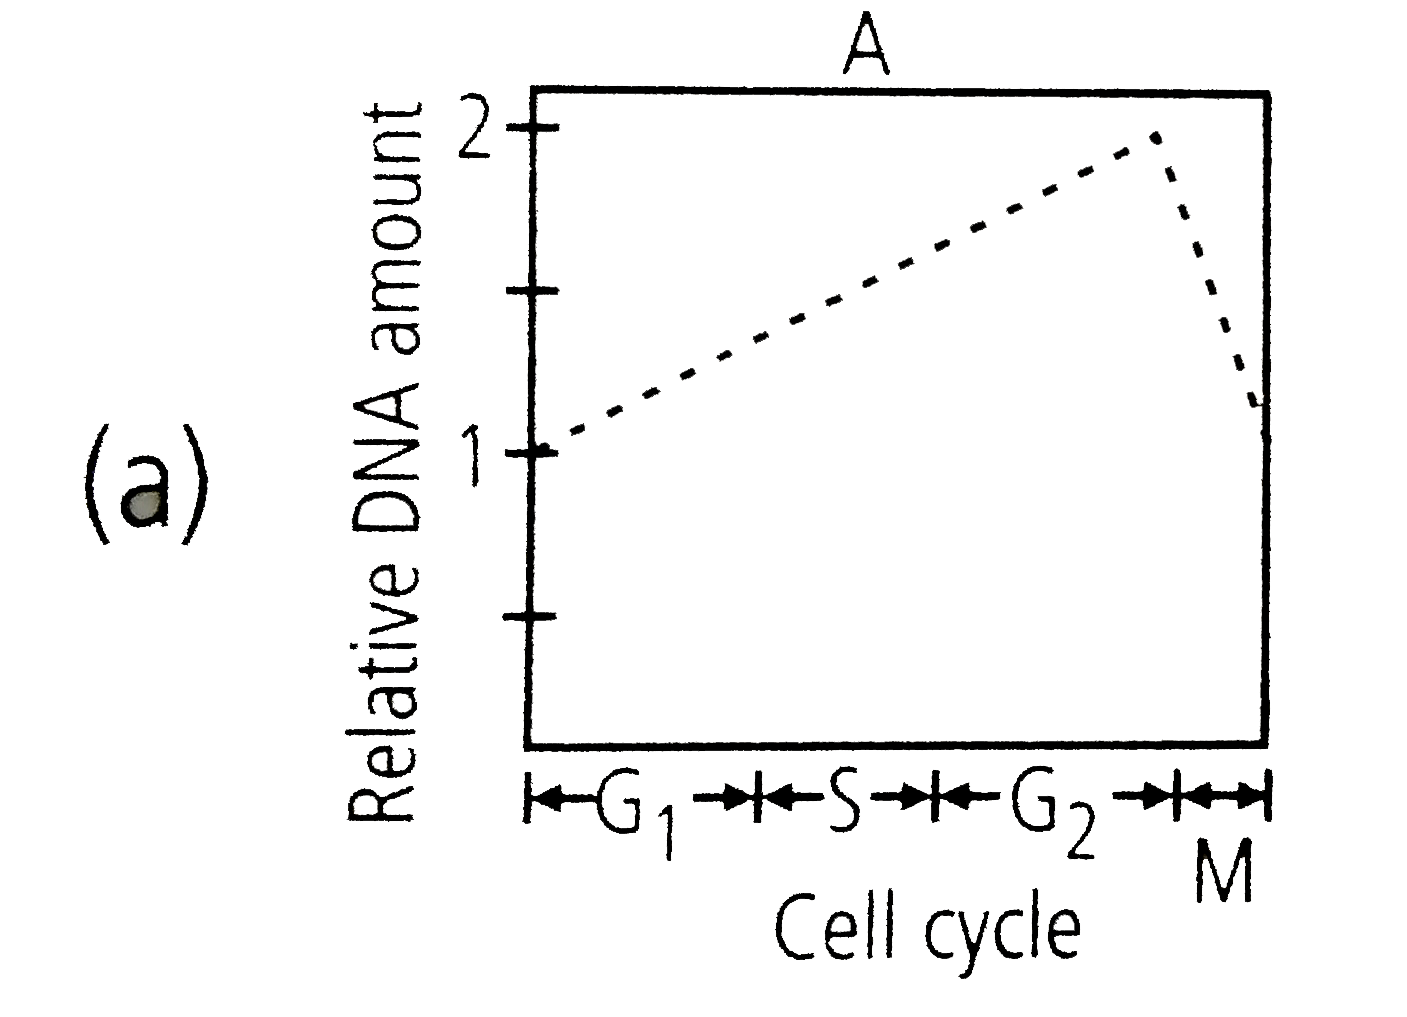 B
B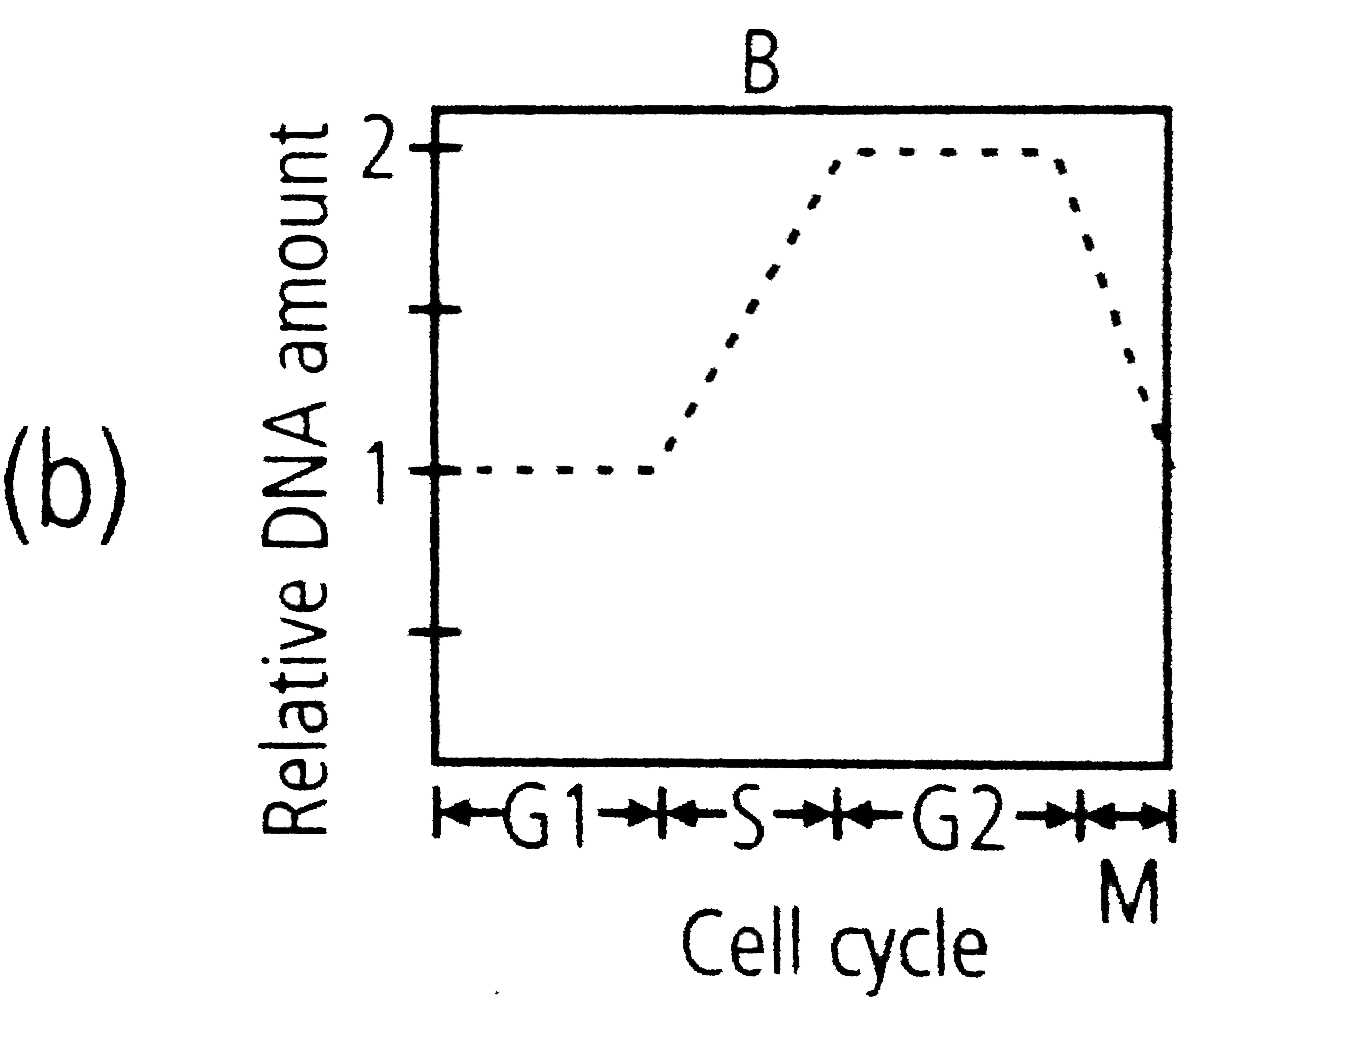 C
C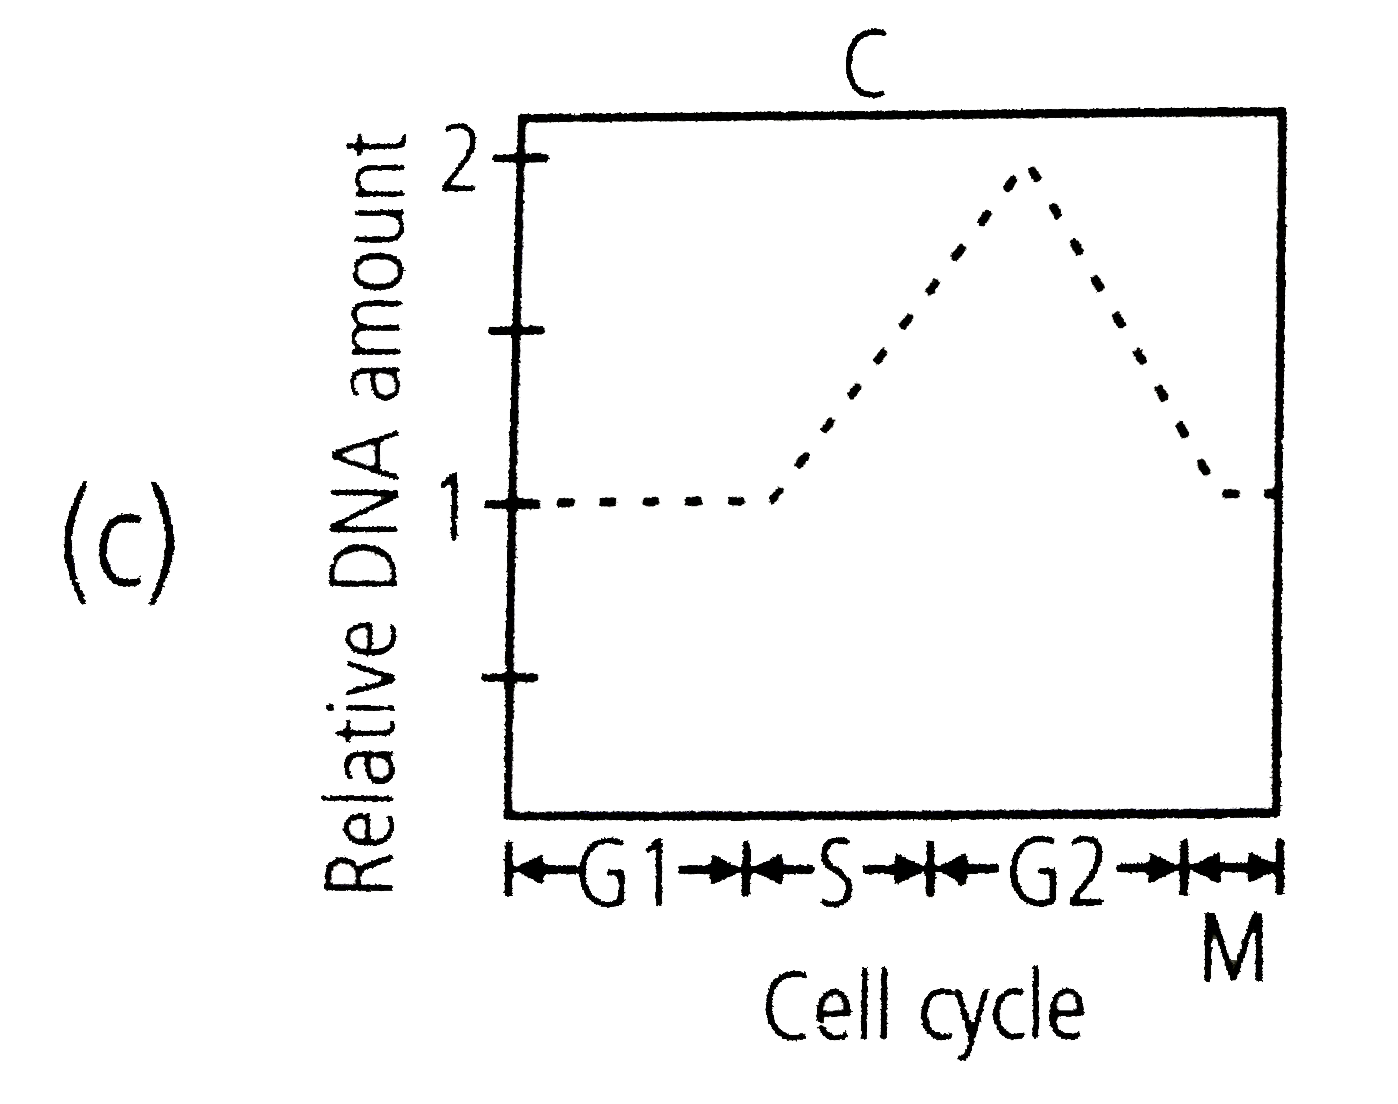 D
D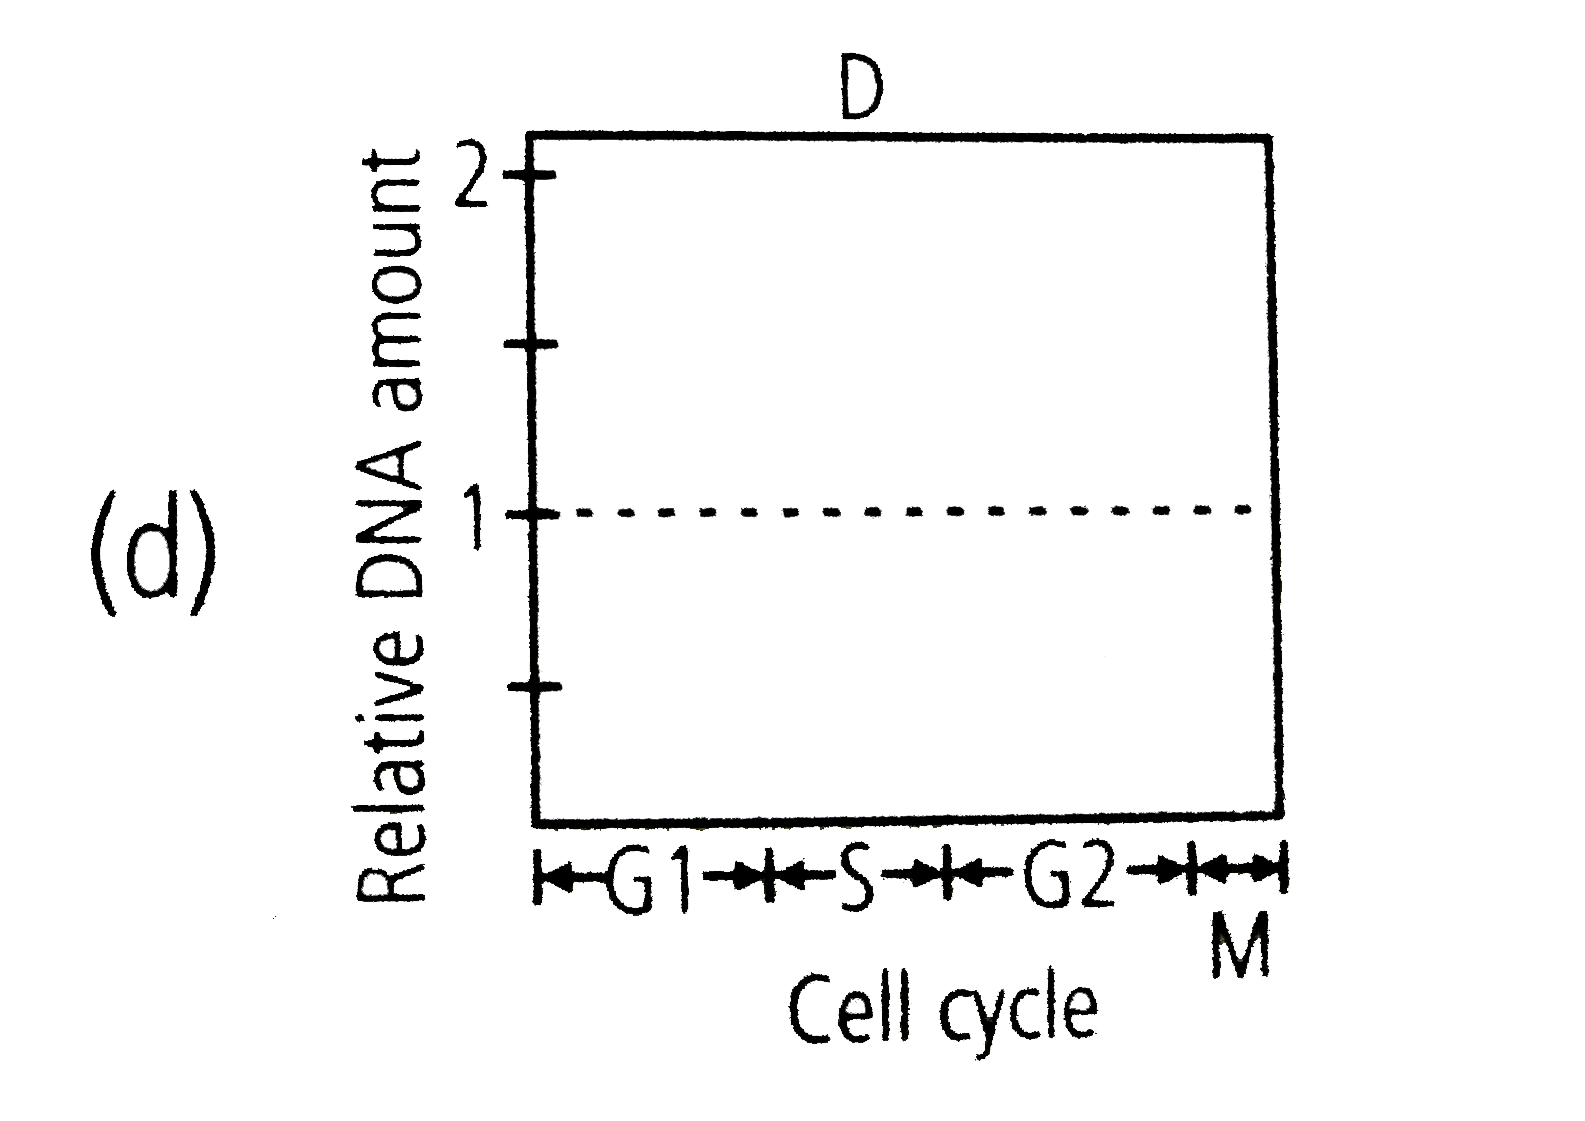
- Question 2 - Select One
The graph given below shows the variations in the population of producers, primary consumers and secondary consumers as well as the amount of dissolved mineral salts in a pond
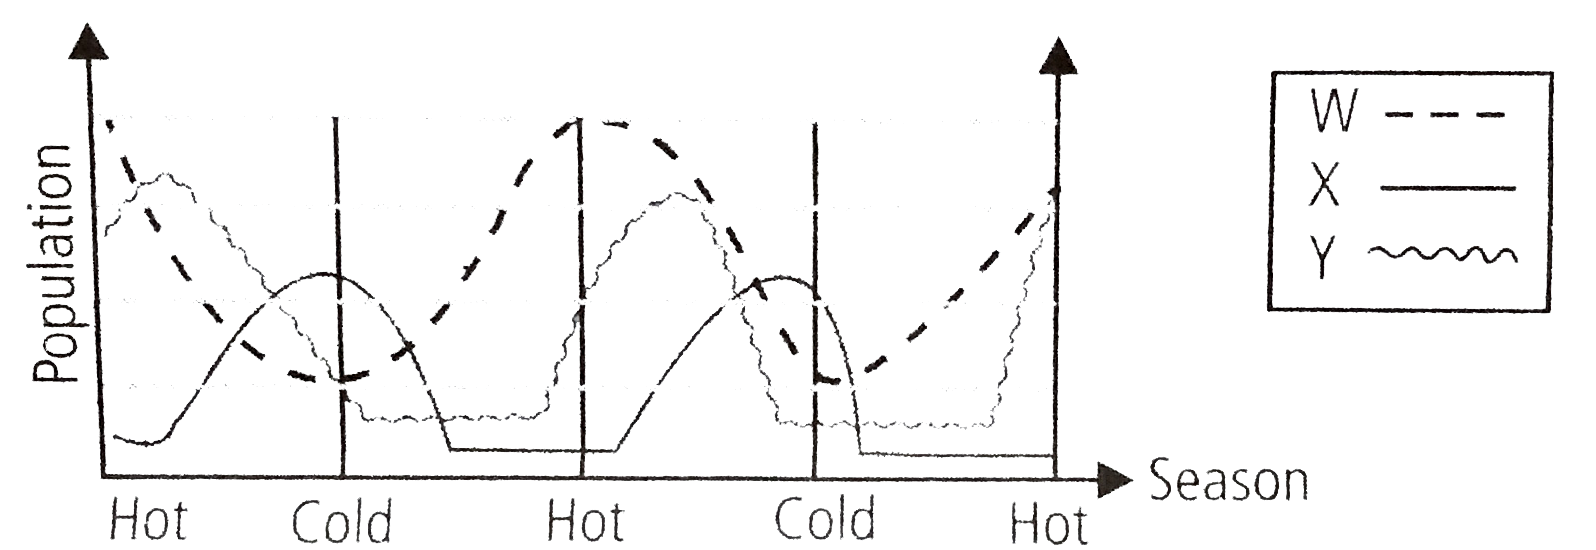
Which one of the following correctly matches each graph?AProducer populationPrimary consumer populationSecondary consumer populationXYWBProducer populationPrimary consumer populationSecondary consumer populationWXYCProducer populationPrimary consumer populationSecondary consumer populationWYXDProducer populationPrimary consumer populationSecondary consumer populationXWY
The diagram given below is that of a developing human foetus. Study the diagram and then answer the questions that follow :
Mention the sex chromosomes in a male and female embryo.View SolutionThe diagram showing the variation of gravitational potential of earth with distance from the centre of earth is
View SolutionThe diagram shows an important concept in the genetic implicatio of DNA. Fill in the blanks A to C.
 View Solution
The diagram shows an important concept in the genetic implicatio of DNA. Fill in the blanks A to C.
 View Solution
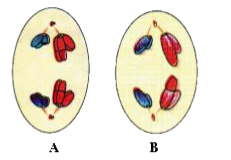
Given diagrams shows the phases of meiosis. Identify the phases :-
 View Solution
Shows an arrangement of identical metal plates paraed parallel to each other. The diagram also shows the variation of potential berween the plates . Using the details given in the diagram, find the equivalent capacitance connected across the battery (sepaaration between the consecutive plates is equal to l and the cross-sectional area of each plate is A).
 . View Solution

