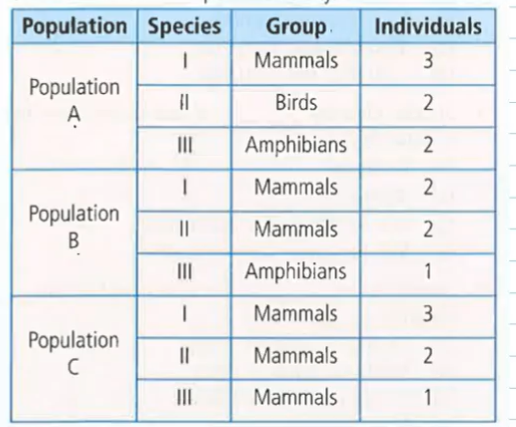
Study the given populations and choose the correct answer in relation to species diversity.
A
Maximum diversityMinimum diversityPopulation BPopulation C
B
Maximum diversityMinimum diversityPopulation APopulation C
C
Maximum diversityMinimum diversityPopulation APopulation B
D
Maximum diversityMinimum diversityPopulation BPopulation A
Text Solution
The correct Answer is:B
|
Topper's Solved these Questions
- BIODIVERSITY & CONSERVATIONBOOK - NCERT FINGERTPS ENGLISHCHAPTER - BIODIVERSITY & CONSERVATIONEXERCISE - HOTS
5 Videos
- BIODIVERSITY & CONSERVATIONBOOK - NCERT FINGERTPS ENGLISHCHAPTER - BIODIVERSITY & CONSERVATIONEXERCISE - NCERT (EXEMPLAR PROBLEMS
20 Videos
- BIOTECHNOLOGY - PRINCIPLES AND PROCESSESBOOK - NCERT FINGERTPS ENGLISHCHAPTER - BIOTECHNOLOGY - PRINCIPLES AND PROCESSESEXERCISE - Biotechnology - Principles And Processes
139 Videos
Similar Questions
Knowledge Check
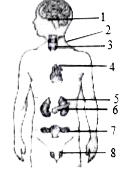
Study the given figure and choose the correct option -
 A2.→ Parathormone
6.→ islets of langerhans
8.→ ICSH production
3.→ ThyroxineB5.→ Adrenaline
1. → FSH production 8.→ Testosterone
4.→ ImmunityC1.→ Master gland
8.→ ICSH production 6.→ Thyroxine
5.→ AdrenalineD7.→ LH production
8.→ Testosterone
6.→ Insulin
4.→ Thyroxine
Study the above given figure and choose the correct match:-
 A1B2C3D4
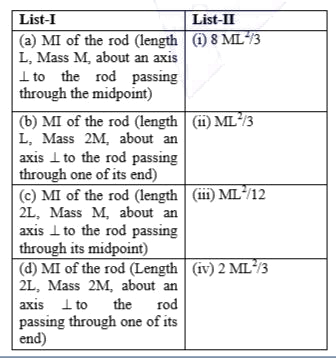
Choose the correct answer from the options given below :A(a)–(ii),(b)–(iii),(c)–(i),(d)–(iv)B(a)–(ii),(b)–(i),(c)–(iii),(d)–(iv)C(a)–(iii),(b)–(iv),(c)–(ii),(d)–(i)D(a)–(iii),(b)–(iv),(c)–(i),(d)–(ii)
Study the given figure and choose the correct option -

View SolutionStudy the figures given below.

Choose the correct option.
View Solutionstudy the given chart and choose the correct option with appropriate alphabets.
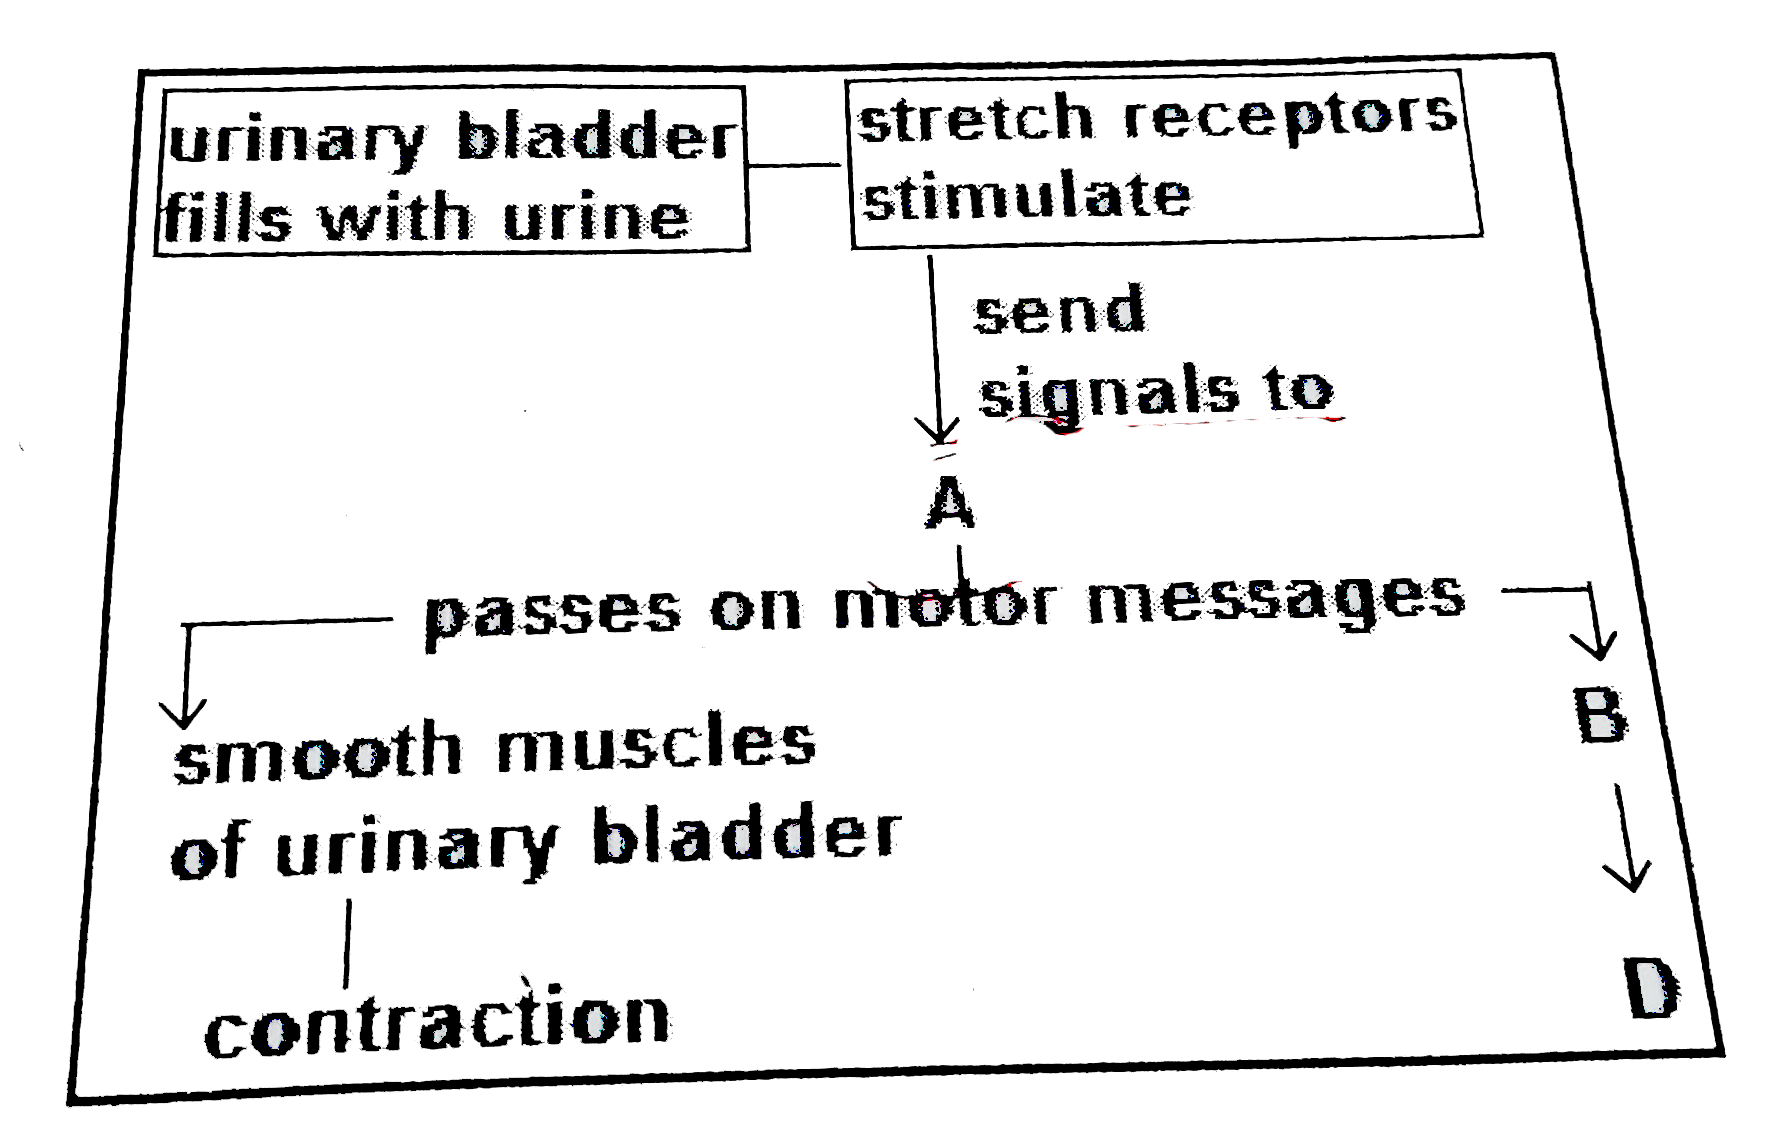
View Solutionstudy the given chart and choose the correct option with appropriate alphabets.

View SolutionChoose the correct answers for a given amount of hydrogen.
View Solution

