The given figure illustrates montly changes in the human ovary during the reproduction cycle.
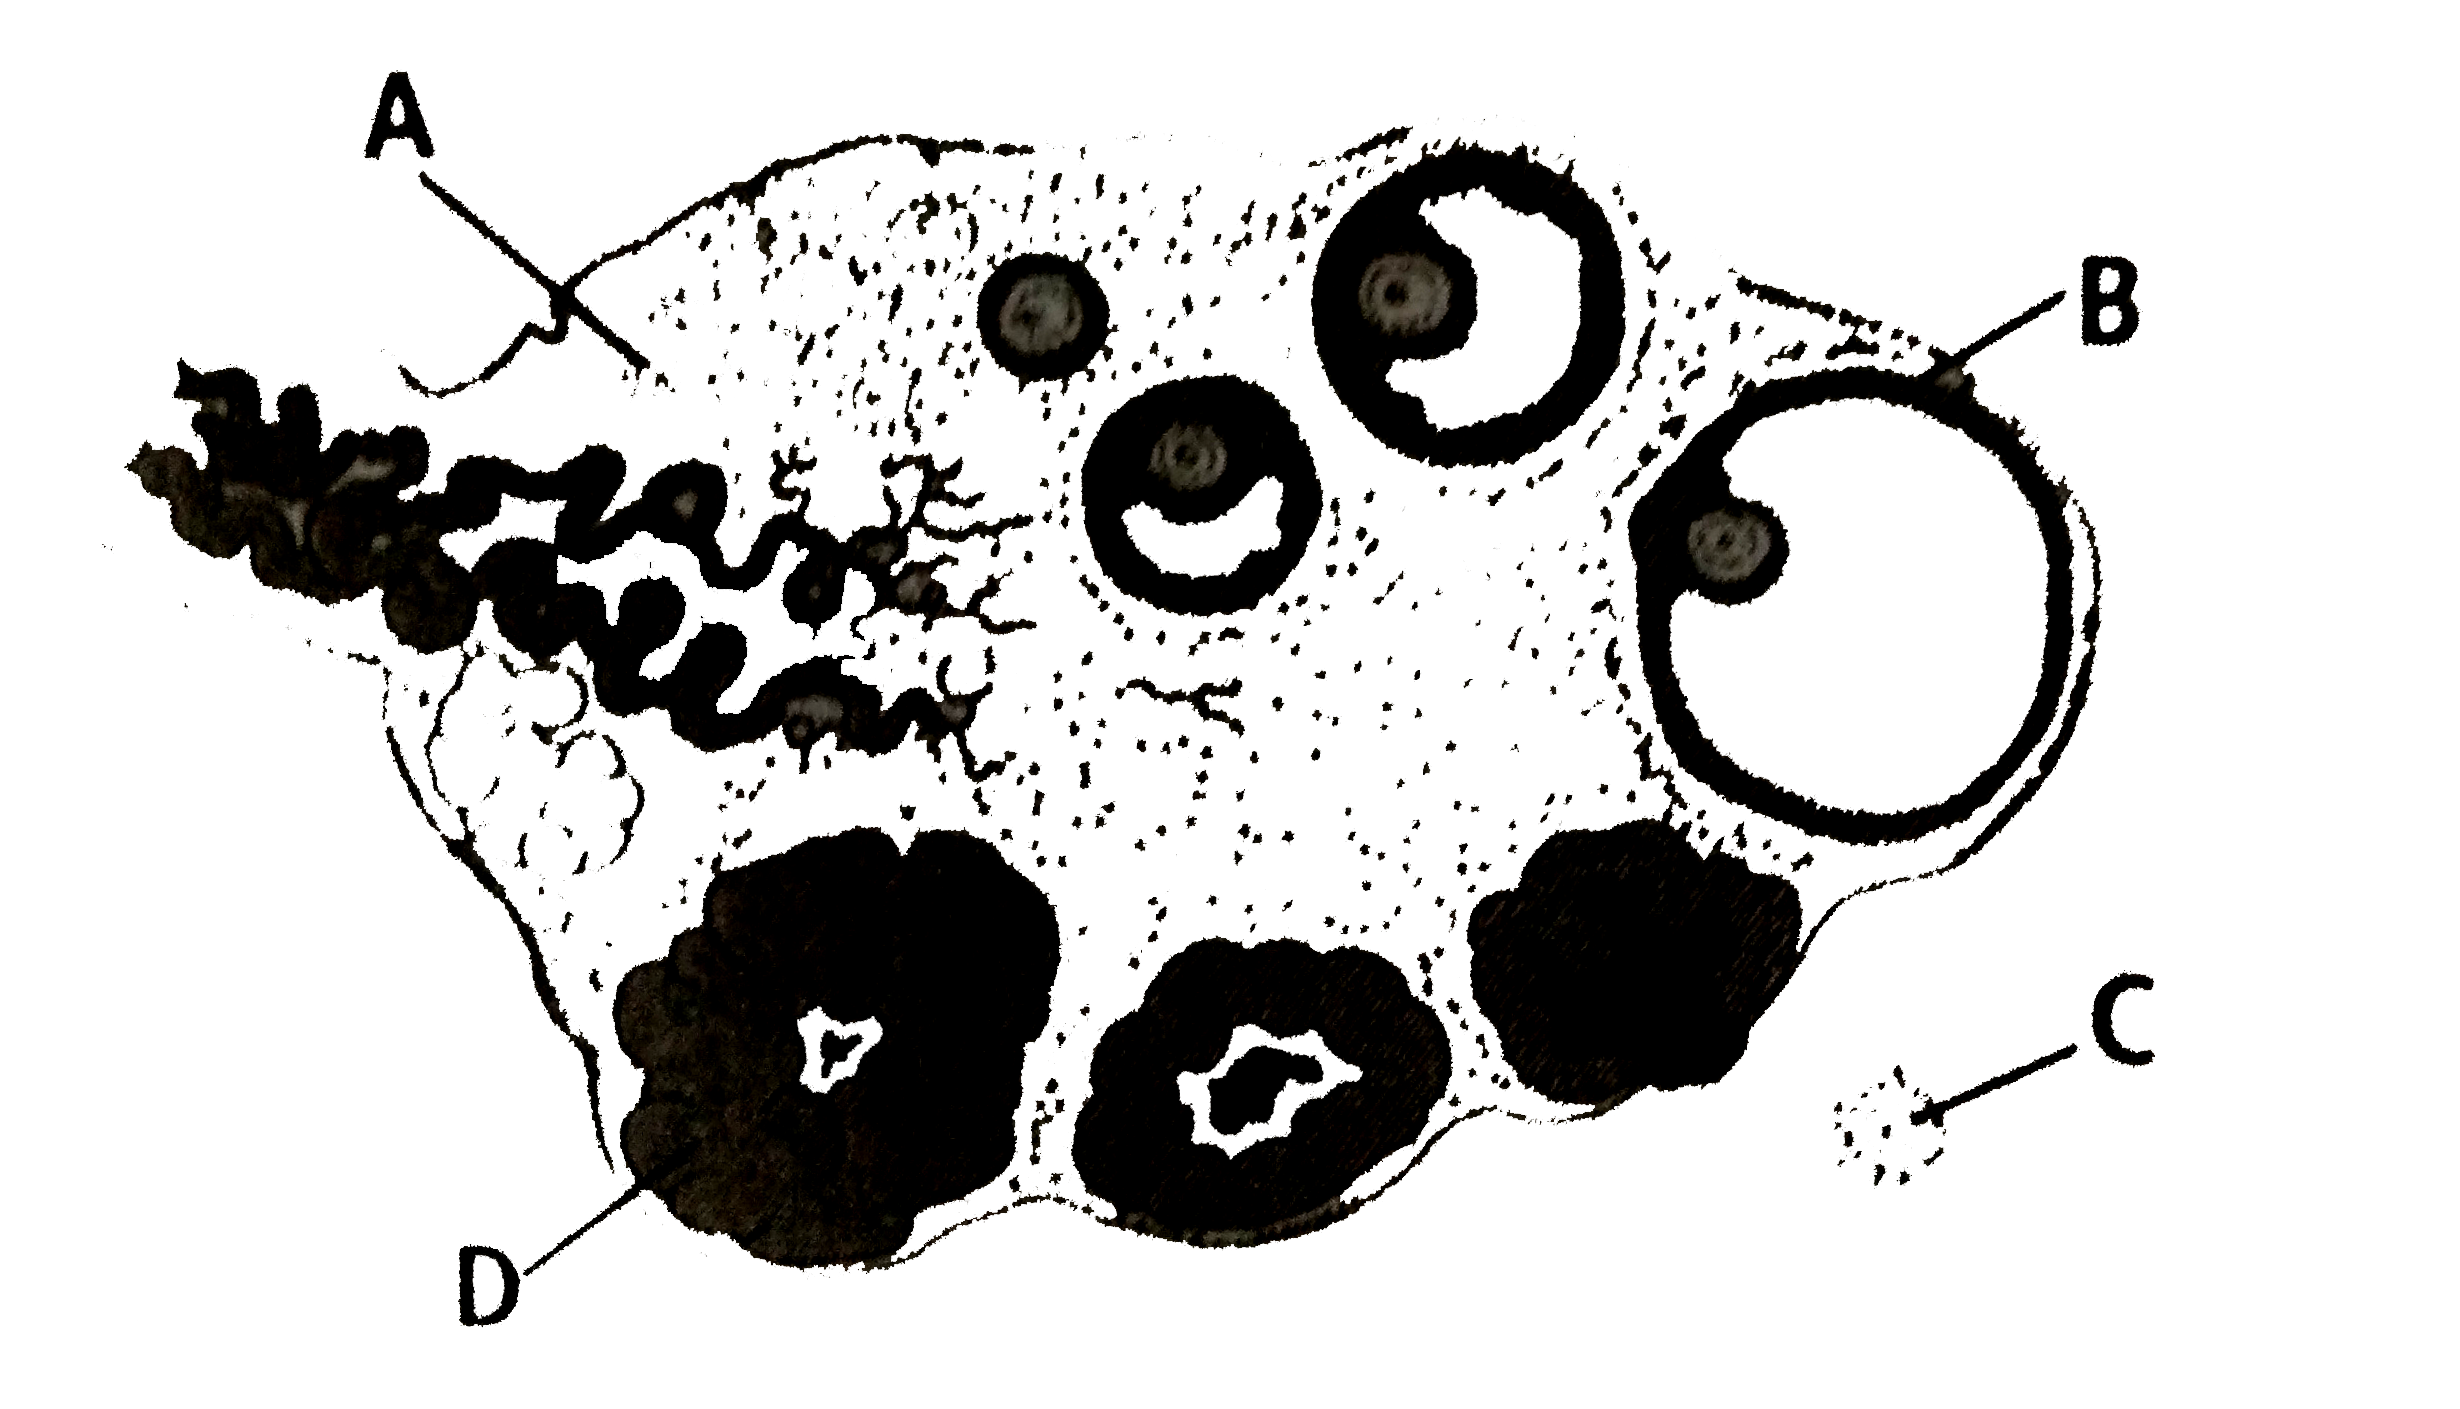
Which of the following statements most accurately describes each structure?
Before puberty, the oocyte (A) does not start the process of meiosis.
The hormone produced by by structure (B) causes thinning of the uterine cervical mucus to allow passage of sperms.
During ovulation, structure (C) stays at the interphase between meiosis I and meiosis II.
The hormone produced by structure (D) stimulates the pituitary gland to secrete luteinising hormone.
The correct Answer is:B
At birth, ovaries contain some 2 million follicles each with an ovum that has begun meiosis but is arrested in prophase of the first meiotic division. At this stage , the ova are called primary oocyte (labelled A). Primary oocyte completes first meiotic division to produce secondary oocyte (labelled C) Which gets arrested in the metaphase of meiosis II. The Graffian follicle (labelled B) secretes estrogen which causes thinning of cervicl mucus to allow easy passage of sperms through the cervix. Progesterone is secreted by corpus luteum (labelled D). It stimulates further development of uterine epithelium and mammary glands. It is also required for maintenance of pregnancy.
Similar Questions
Knowledge Check
Based on the figure given below which of the following statements is not correct ?
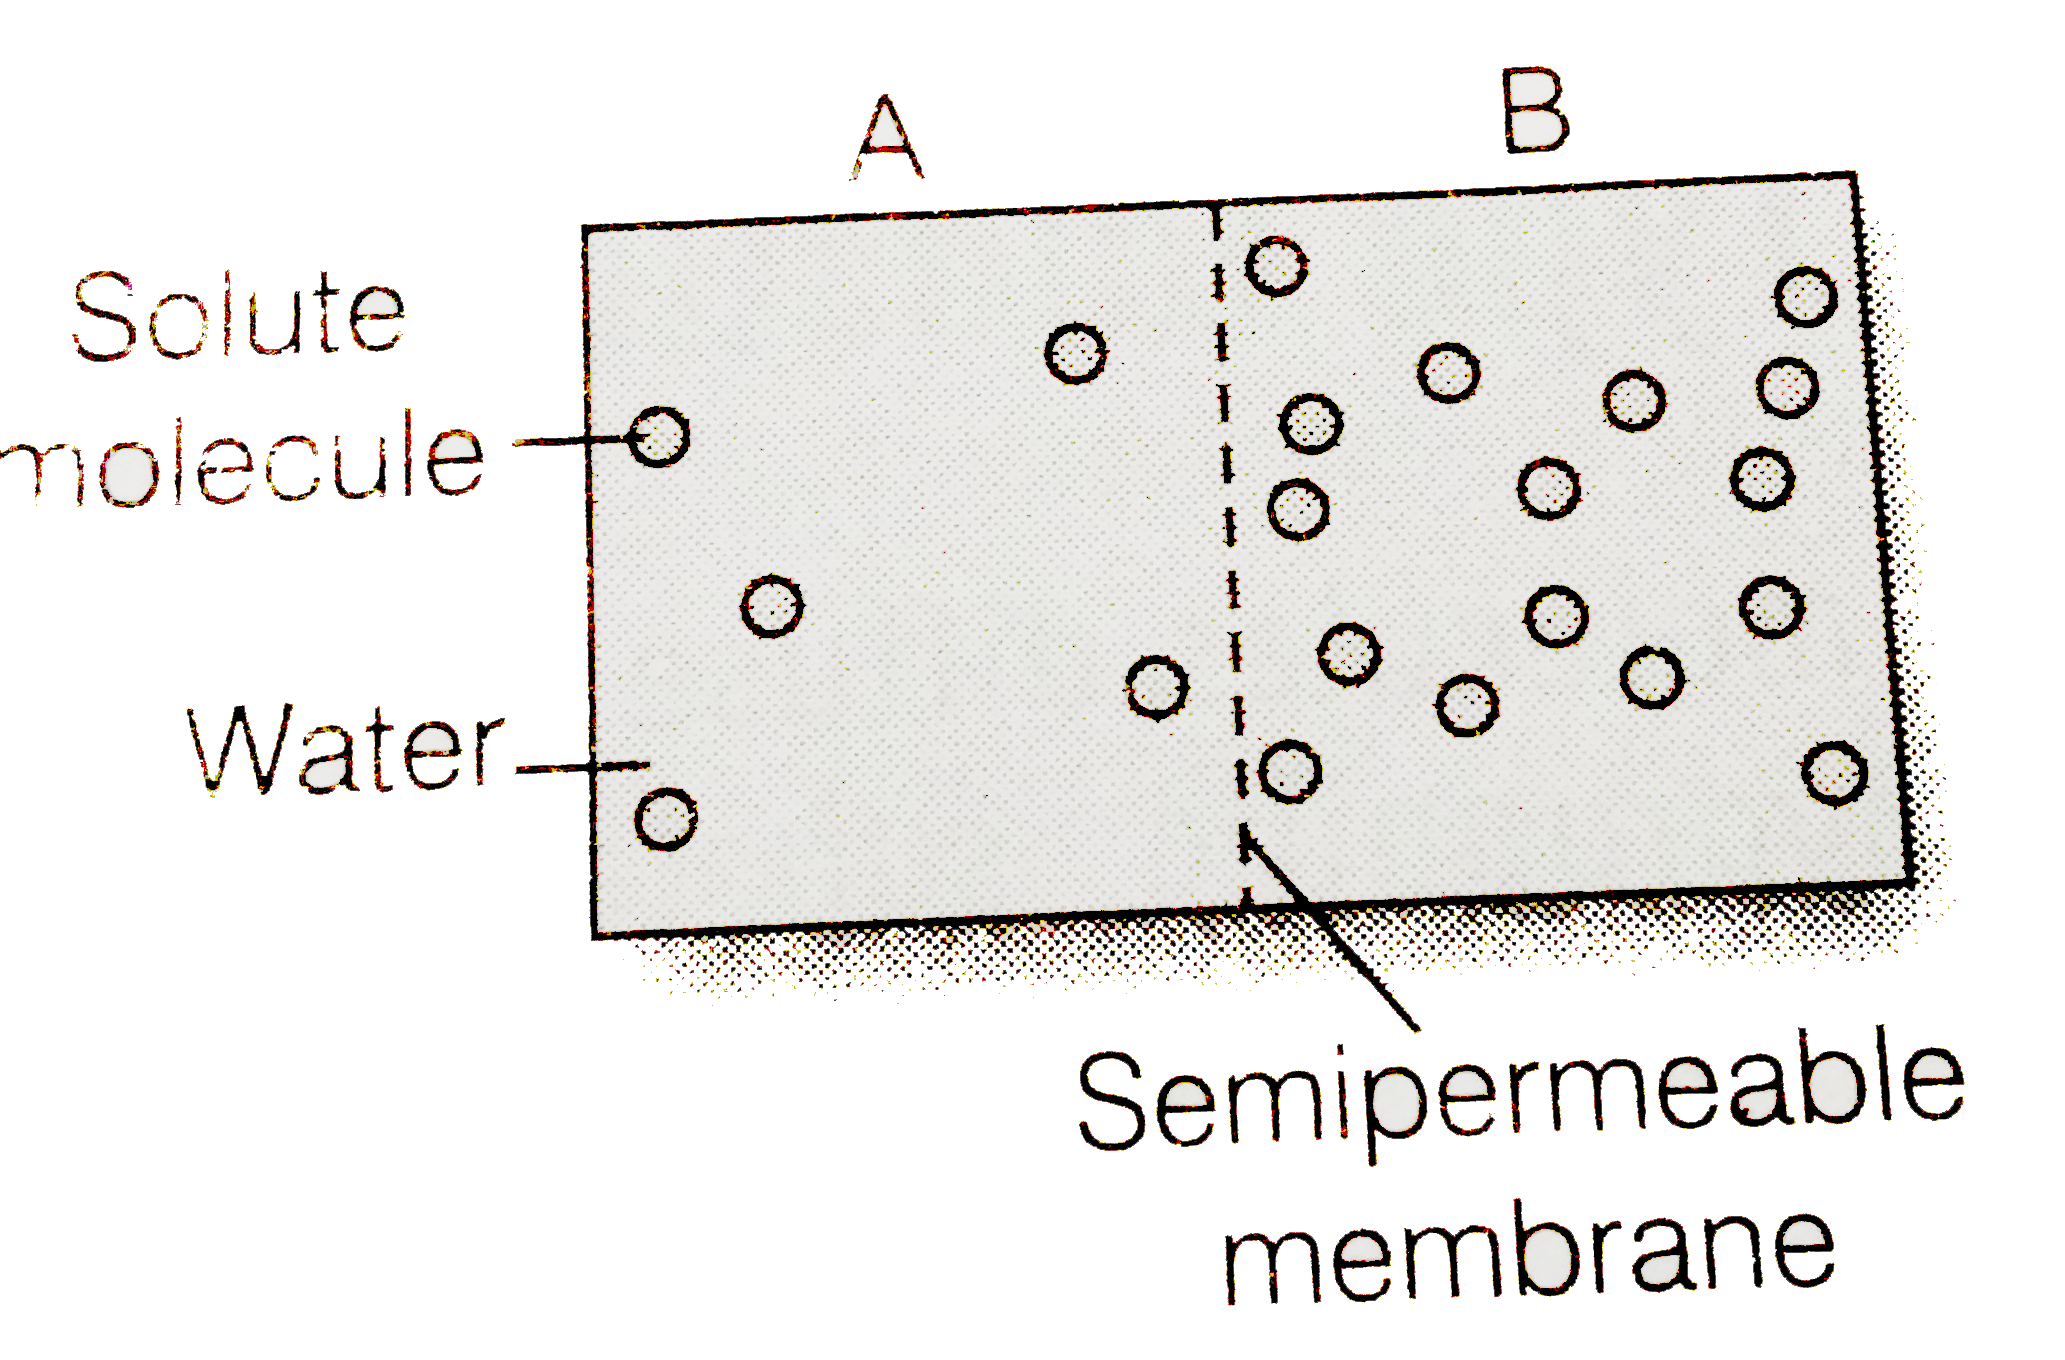 AMovement of solvent molecules will take place from chamber Ato B.BMovement of solute will take place from A to BCPresence of a semi-permeable is a per- requisite for this process to occur.Dthe direction and rate of osmosis depends on both the pressure gradient and concentration gradient.
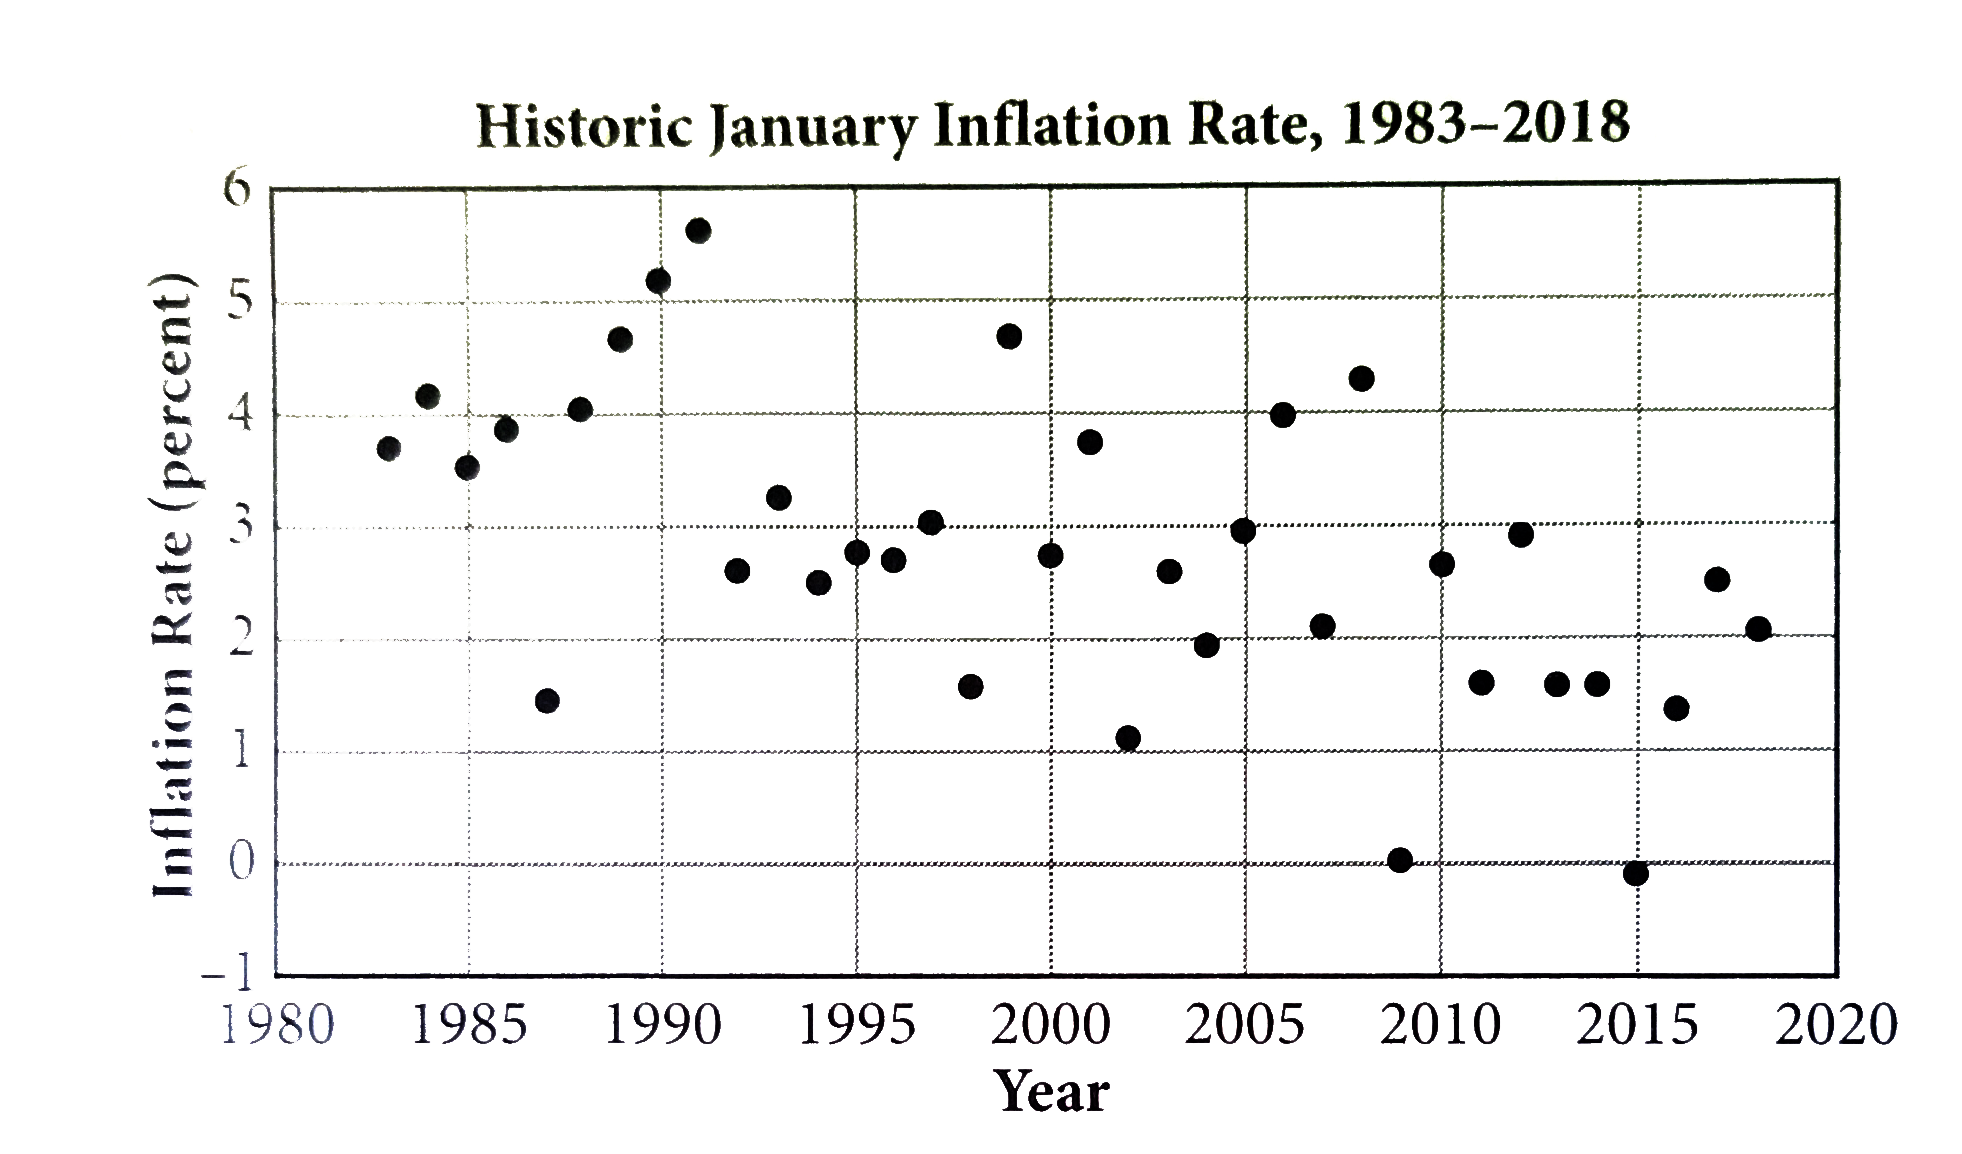
Which of the following is the most accurate statement about the scatterplot above ?AThe data in the scatterplot has a weak positive correlation.BThe data in the scatterplot has a stong positive correlation.CThe data in the scatterplot has a negative correlation.DThere is no correlation in the data set.The given figure illustrates the changes in lung volume during the process of breathing.
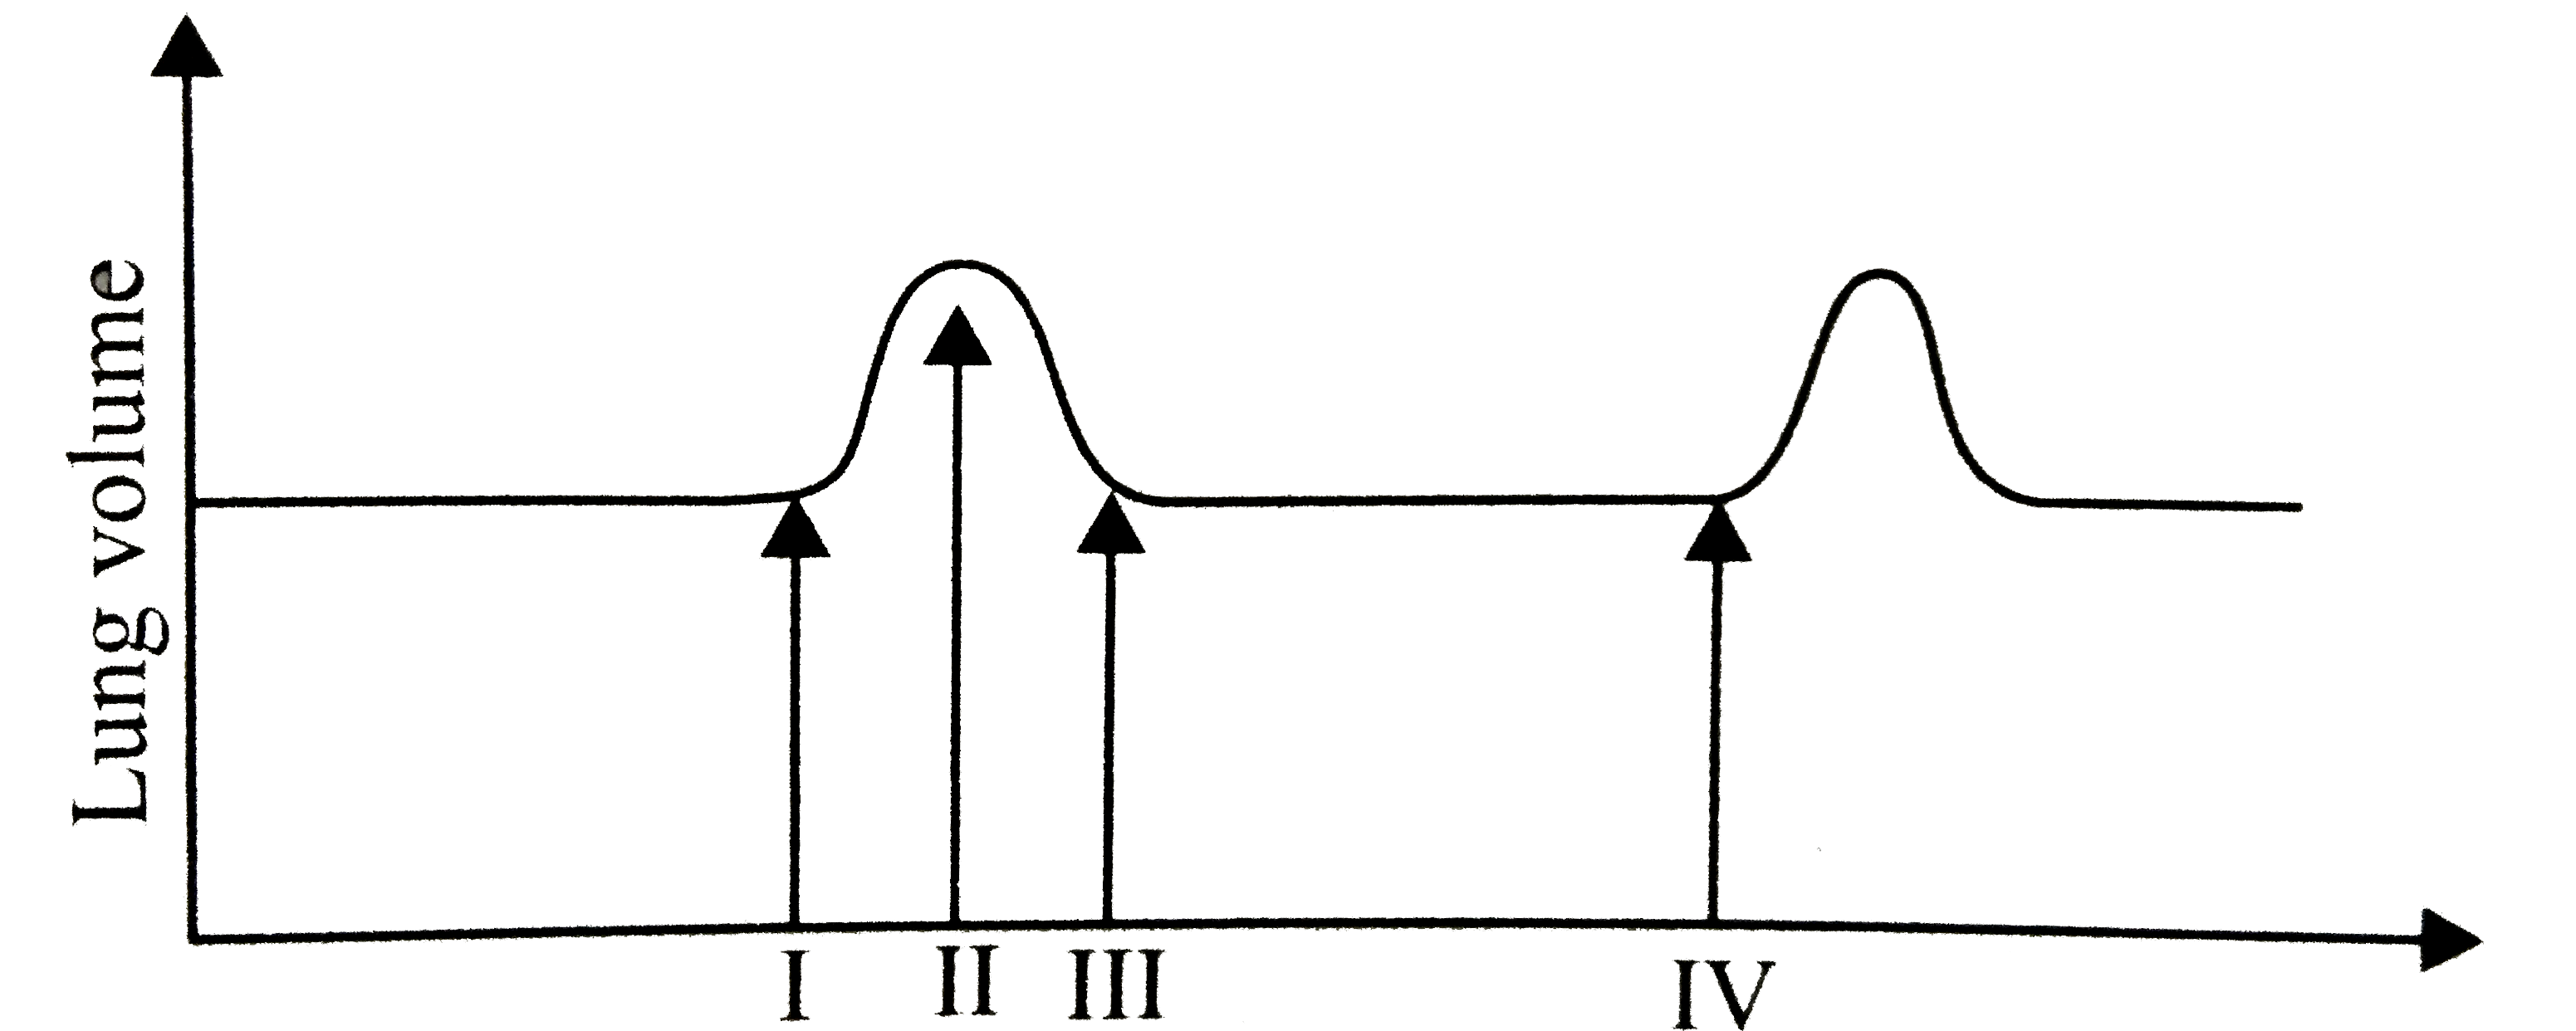
The changes from II to III indicates theAmovement of diaphragm away from the lungsBexpansion of the thoracic cavityCmovement of air out of the lungsDexpansion of ribs.
Which of the following statement is (are) correct in the given figure ?
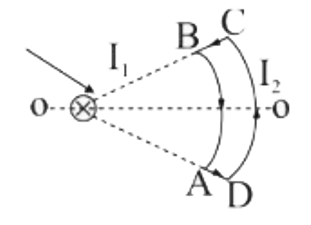
View SolutionIn context of the given figure , which of the following statement is correct?

View SolutionBased on the figure given below which of the following statements is not correct
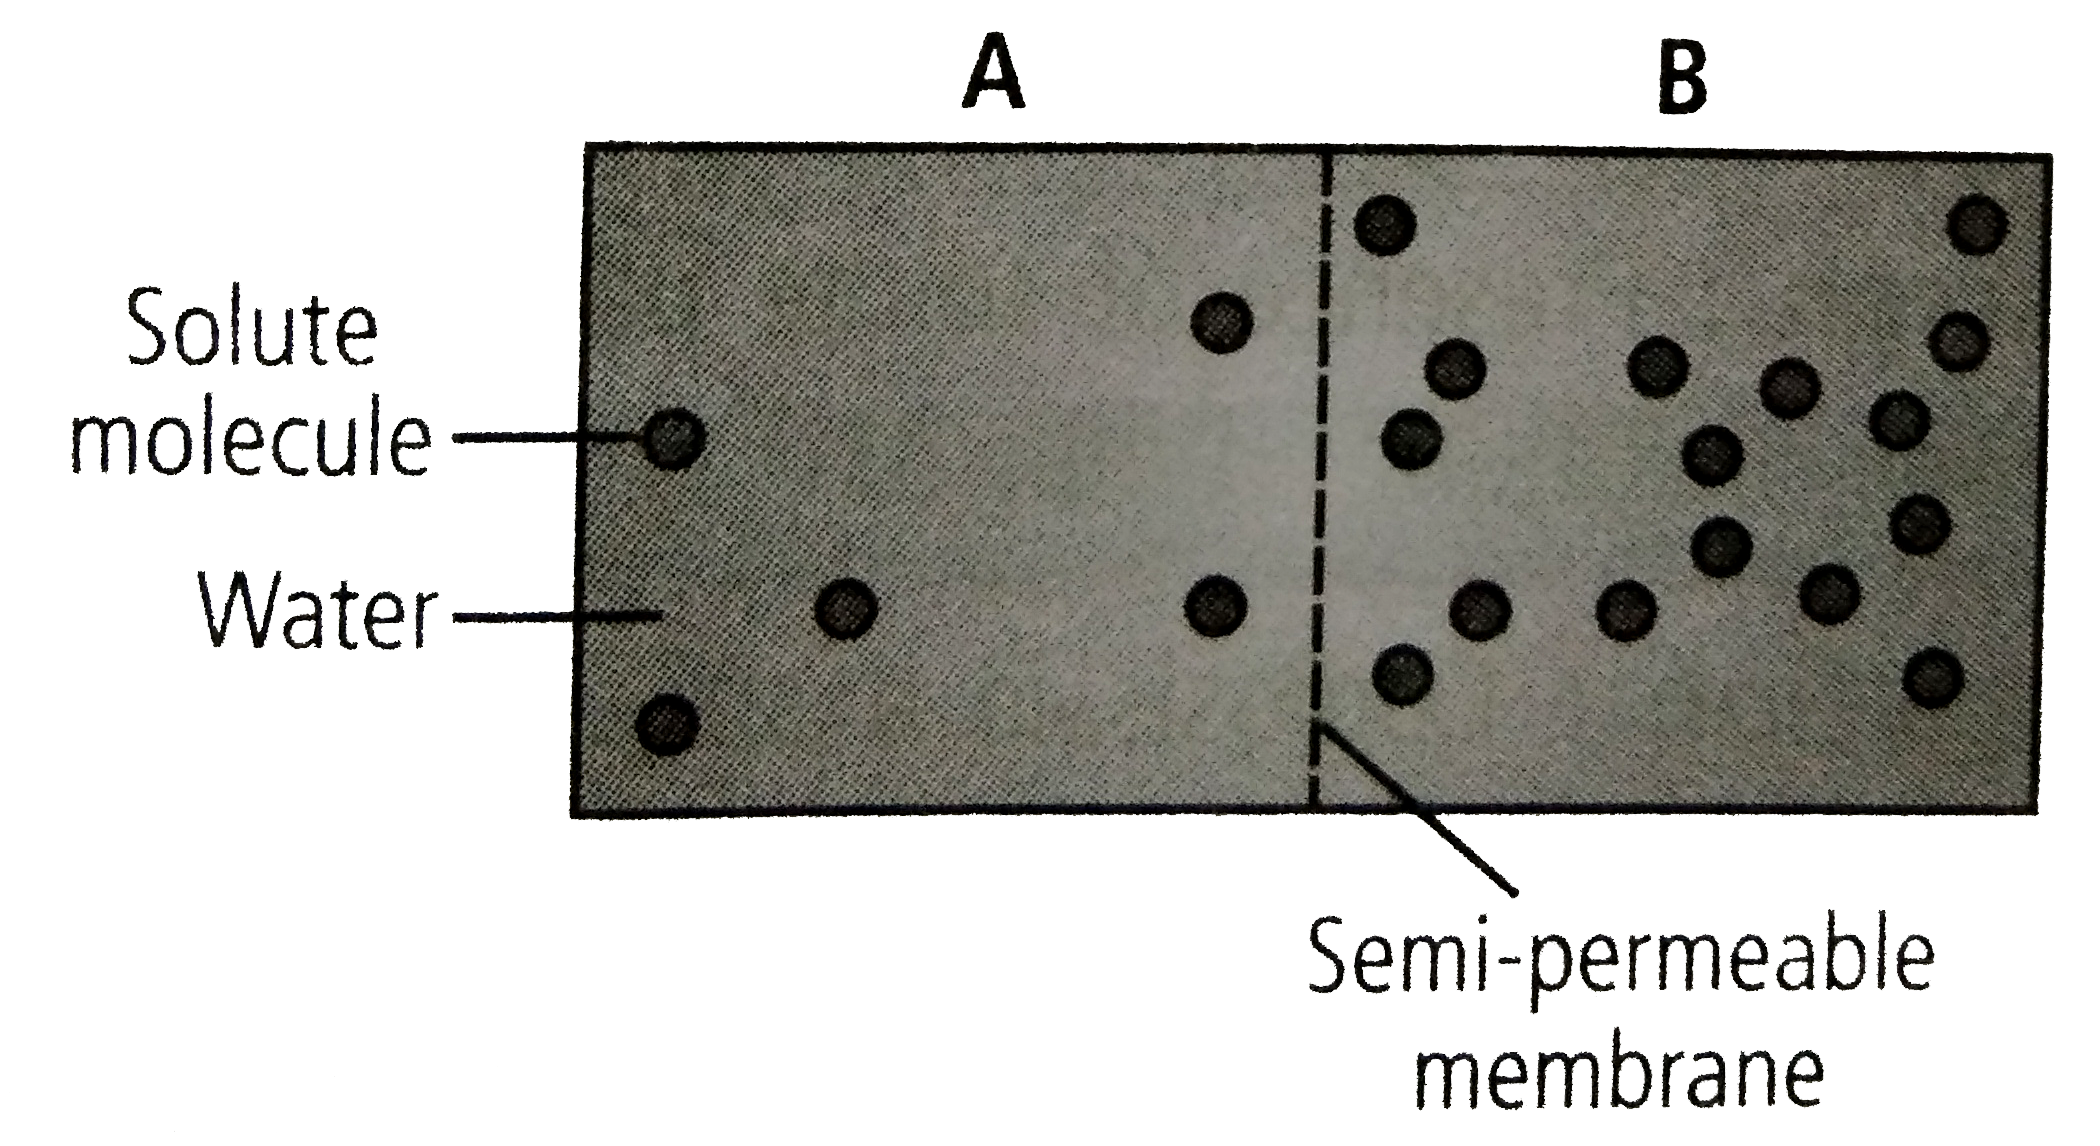
View SolutionBased on the figure given below which of the following statements is not correct ?
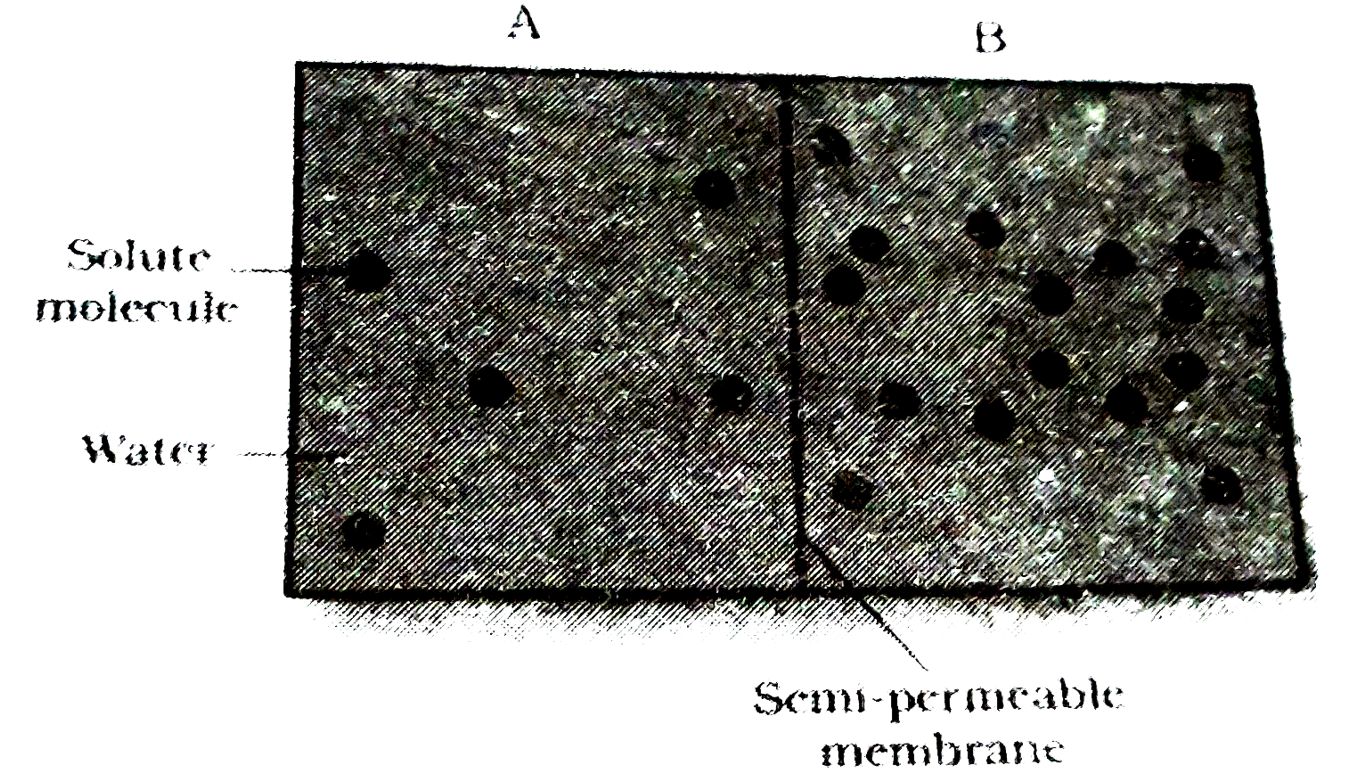
View SolutionStructure of naturally occurring steroide cholesterol is given:
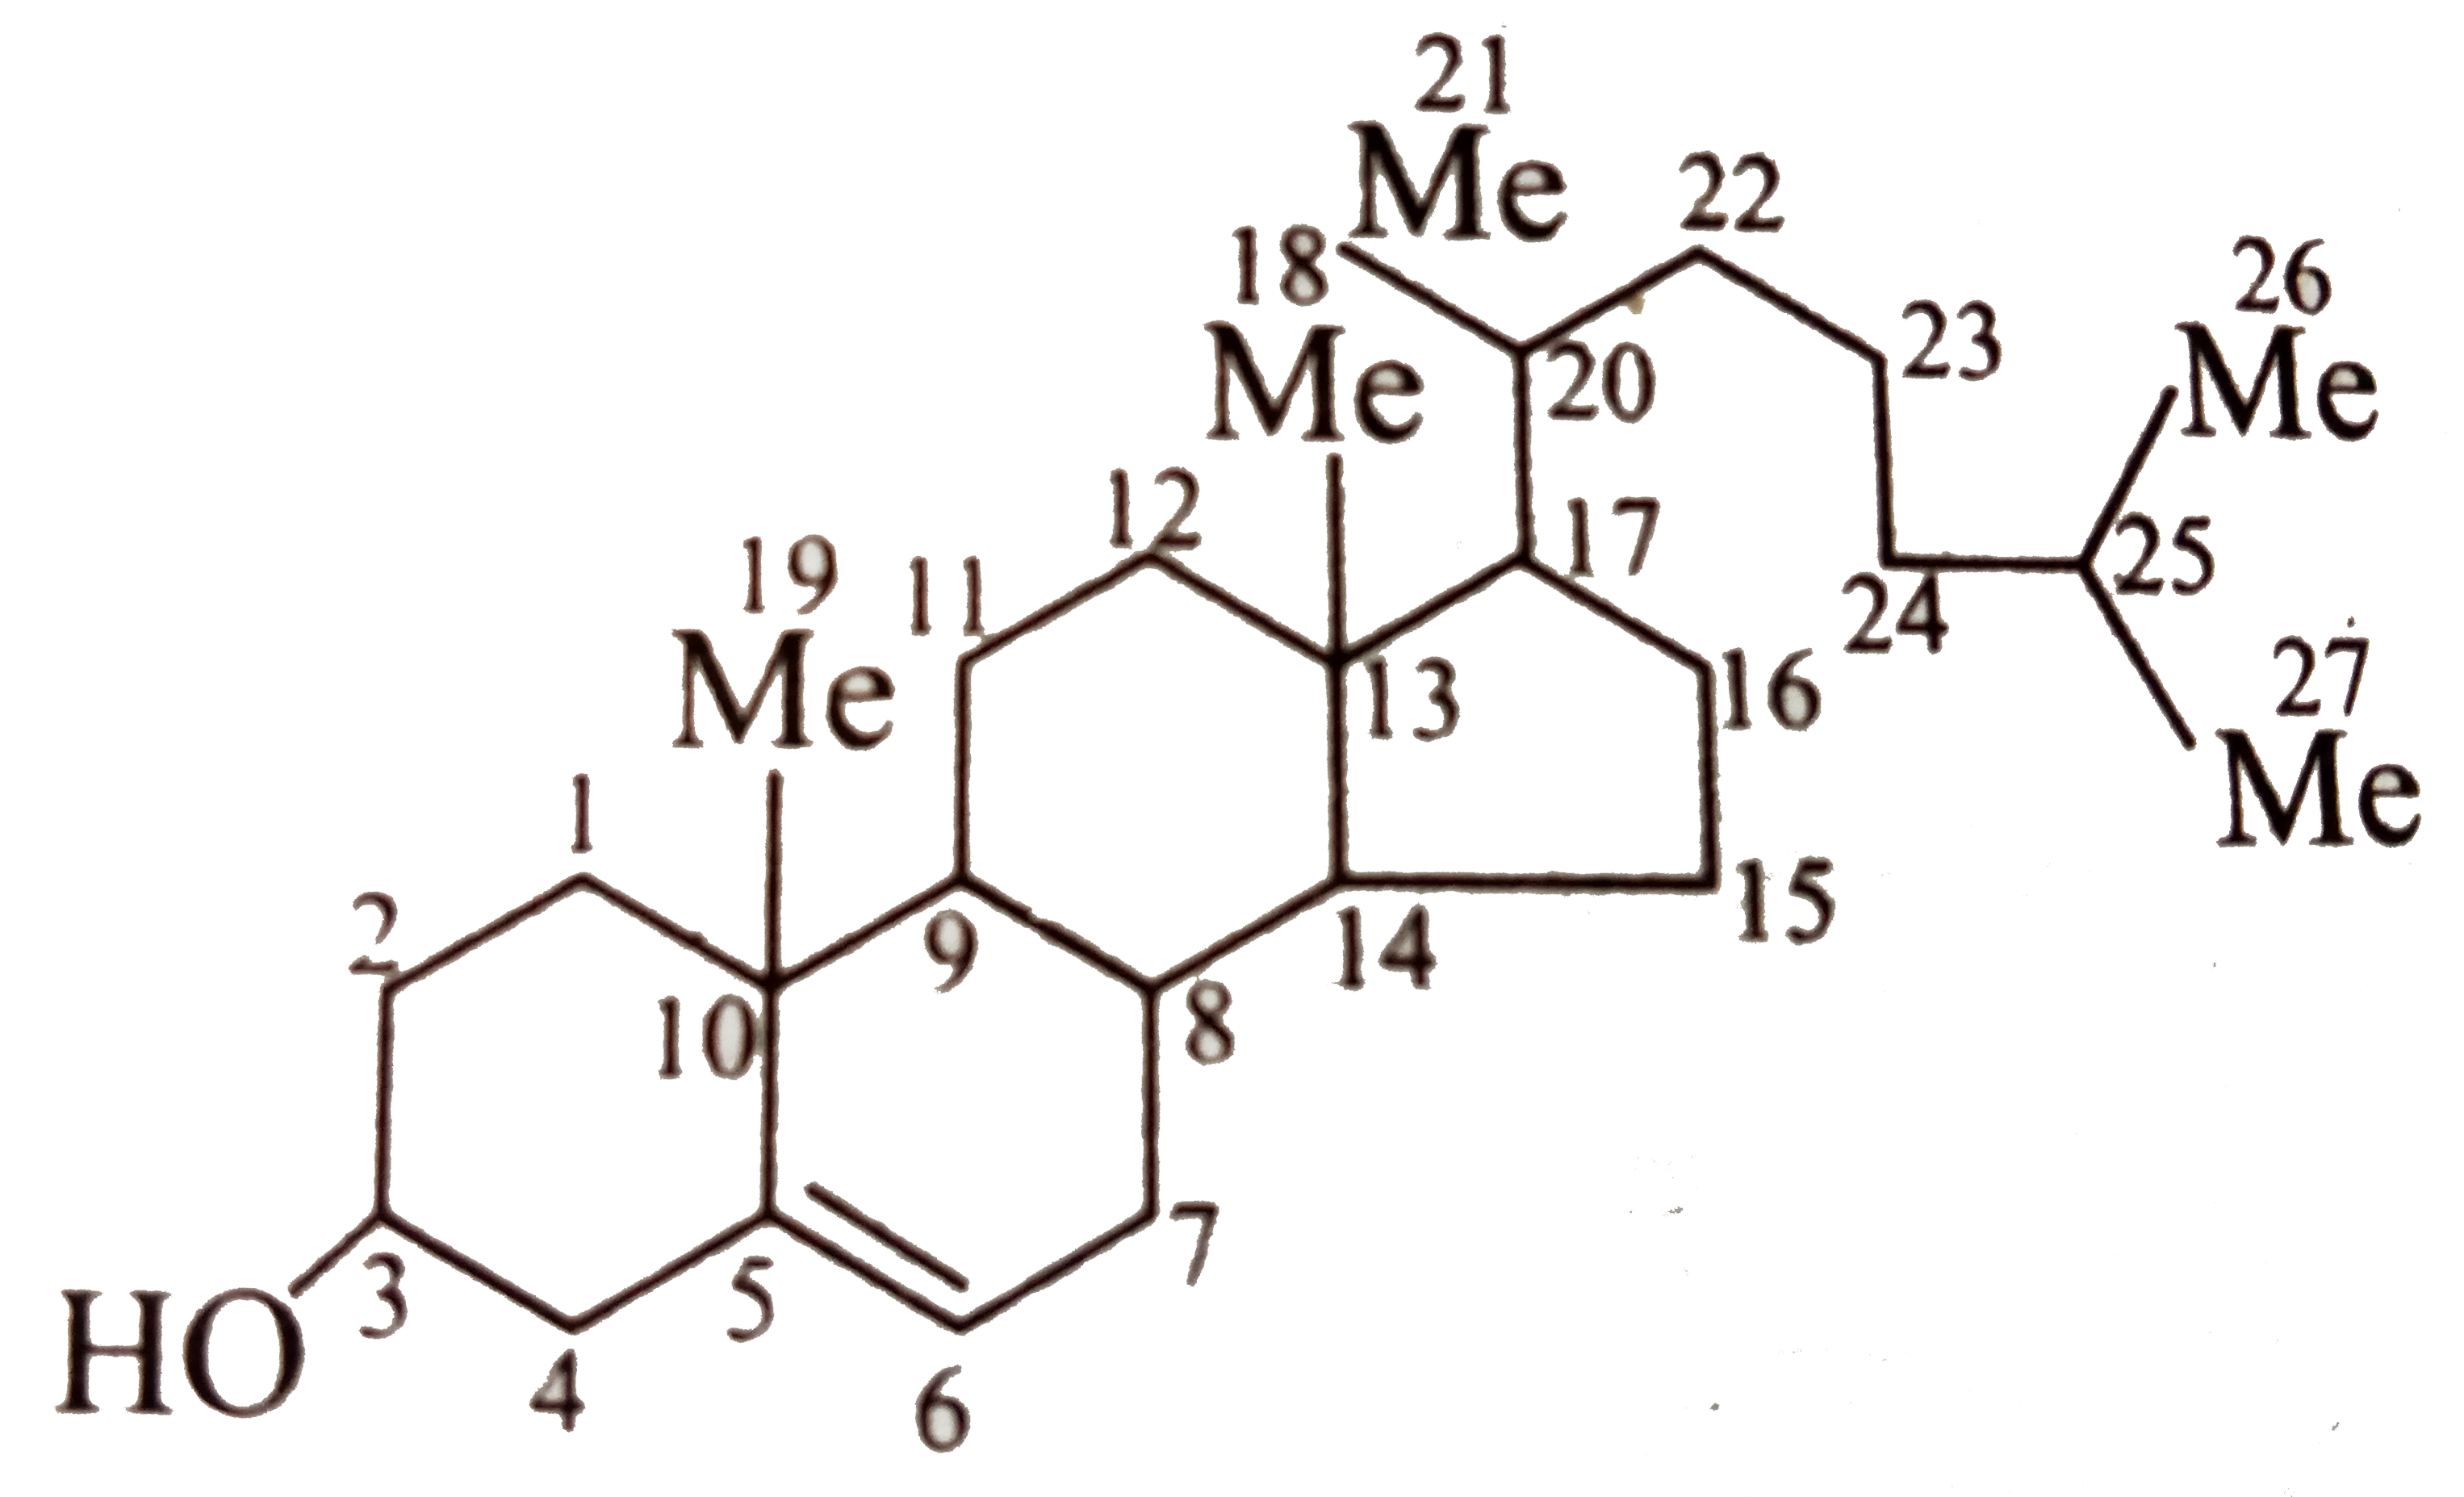
Which of the following statements is/are correct ?
View Solution

