The given graph represents how three different living organisms (X,Y and Z) cope with the external environmental conditions. Study the graph and select the correct option regarding X,Y and Z.
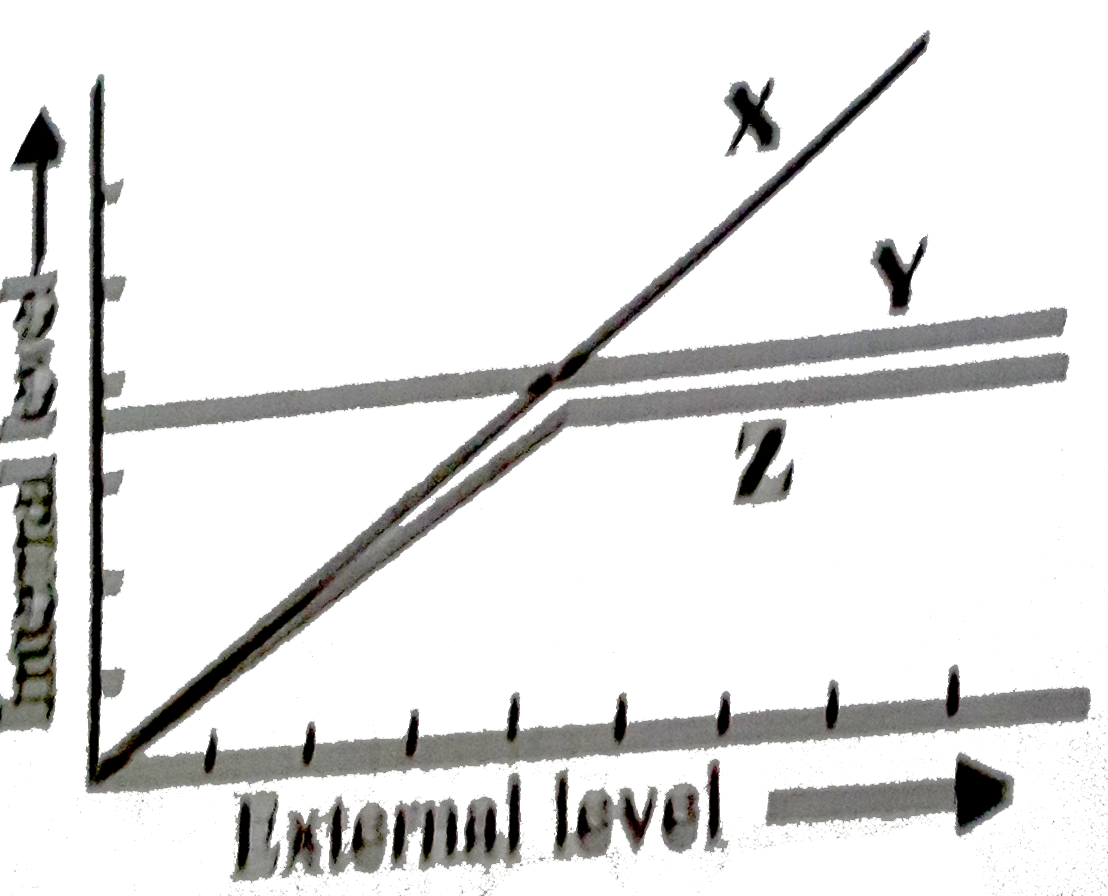
X could be a mammal
Y could be a bird
Z could be a mammal
X could be a bird
The correct Answer is:B
Step by step video, text & image solution for The given graph represents how three different living organisms (X,Y and Z) cope with the external environmental conditions. Study the graph and select the correct option regarding X,Y and Z. by Biology experts to help you in doubts & scoring excellent marks in Class 12 exams.
Topper's Solved these Questions
- BOOK - NCERT FINGERTPS ENGLISHCHAPTER - ORGANISMS AND POPULATIONEXERCISE - HOTS5videos
ORGANISMS AND POPULATION
- BOOK - NCERT FINGERTPS ENGLISHCHAPTER - ORGANISMS AND POPULATIONEXERCISE - NCERT20videos
ORGANISMS AND POPULATION
- BOOK - NCERT FINGERTPS ENGLISHCHAPTER - MOLECULAR BASIS OF INHERITANCEEXERCISE - Molecular Basis Of Inheritance151videos
MOLECULAR BASIS OF INHERITANCE
- BOOK - NCERT FINGERTPS ENGLISHCHAPTER - PRACTICE PAPERSEXERCISE - Practice paper150videos
PRACTICE PAPERS
Similar Questions
Knowledge Check
- Question 1 - Select One
Refer to the given figure and select the correct option regarding X,Y and Z.
 AXYZBrachioaurusArchaeopteryxTriceratopsBXYZArchaeopteryxTryannosaurusPteranodonCXYZArchaeopteryxStgosaurusTryrannosaurusDXYZArchaeopteryxBrachiosaurusTriceratops
 - Question 2 - Select One
Identify X,Y and Z in the given diagram representing steps of citric acid cycle and select the correct option.
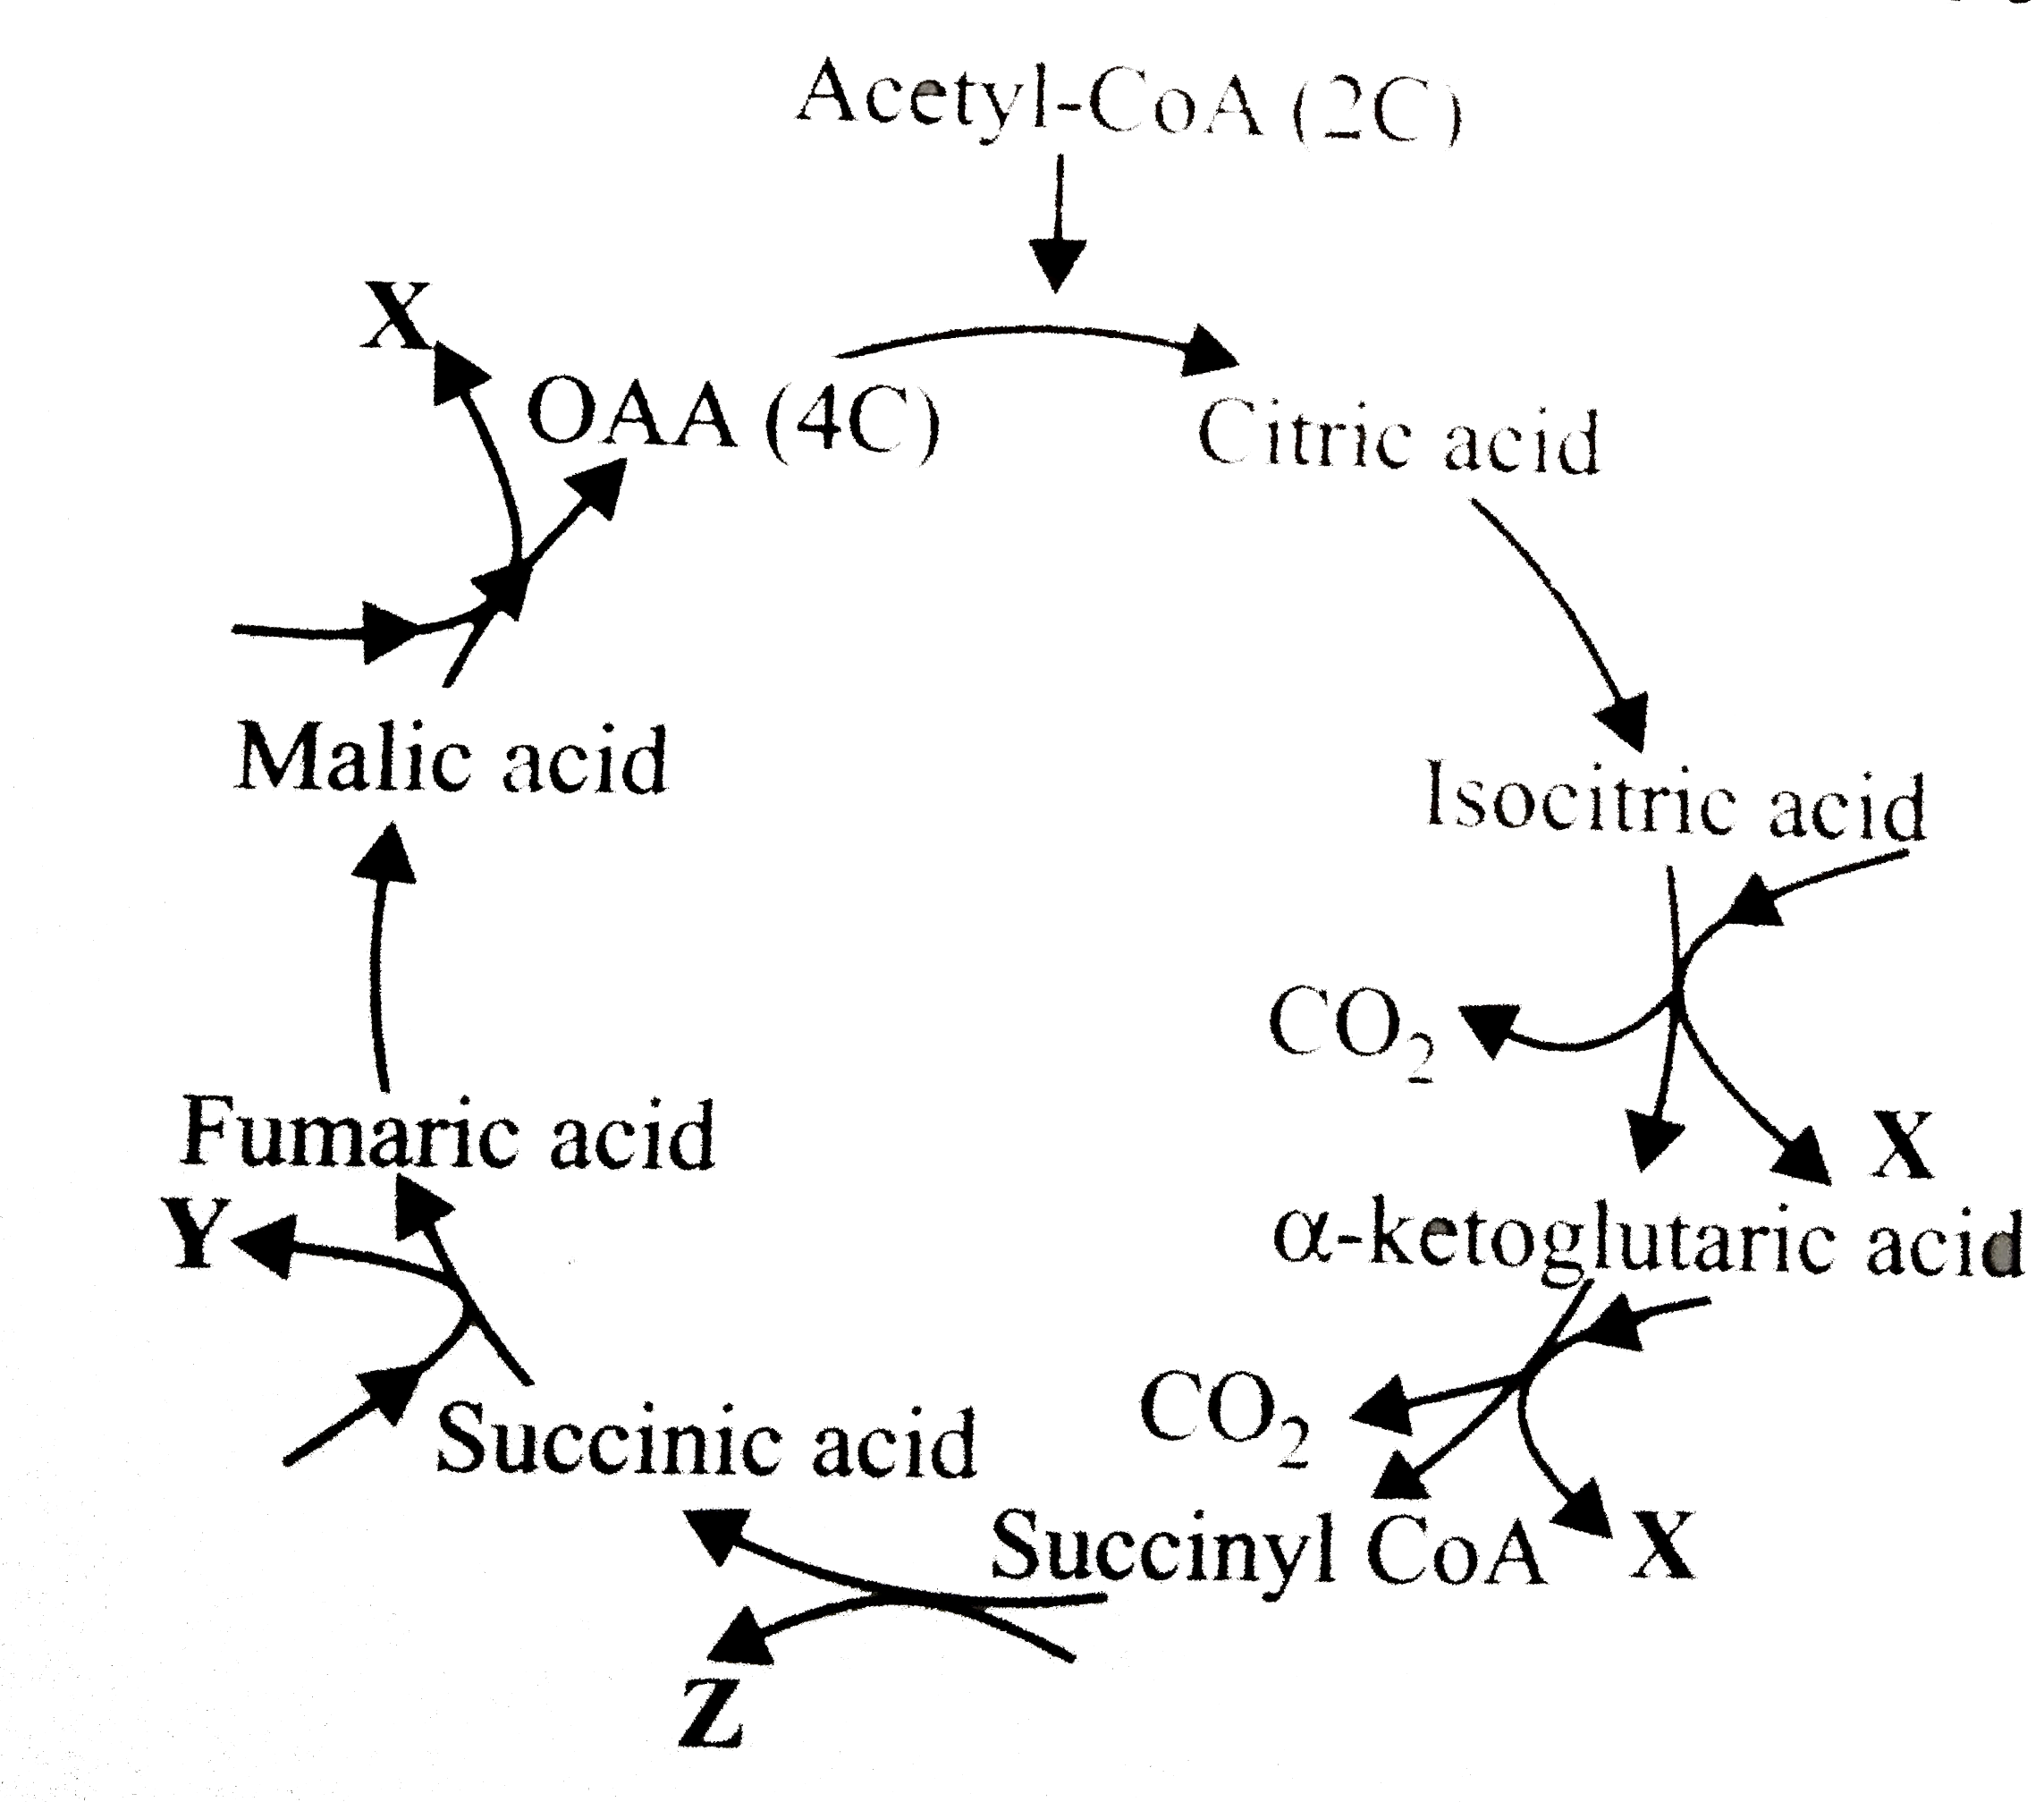 AXYZGTPNADH2FADH2BXYZFADH2NADH2GTPCXYZNADH2FADH2GTPDXYZCO2NADH2ADP
 - Question 3 - Select One
Given graph represents the response of organisms to various abiotic factors. On this basis, select the correct option for (i), (ii) and(iii)
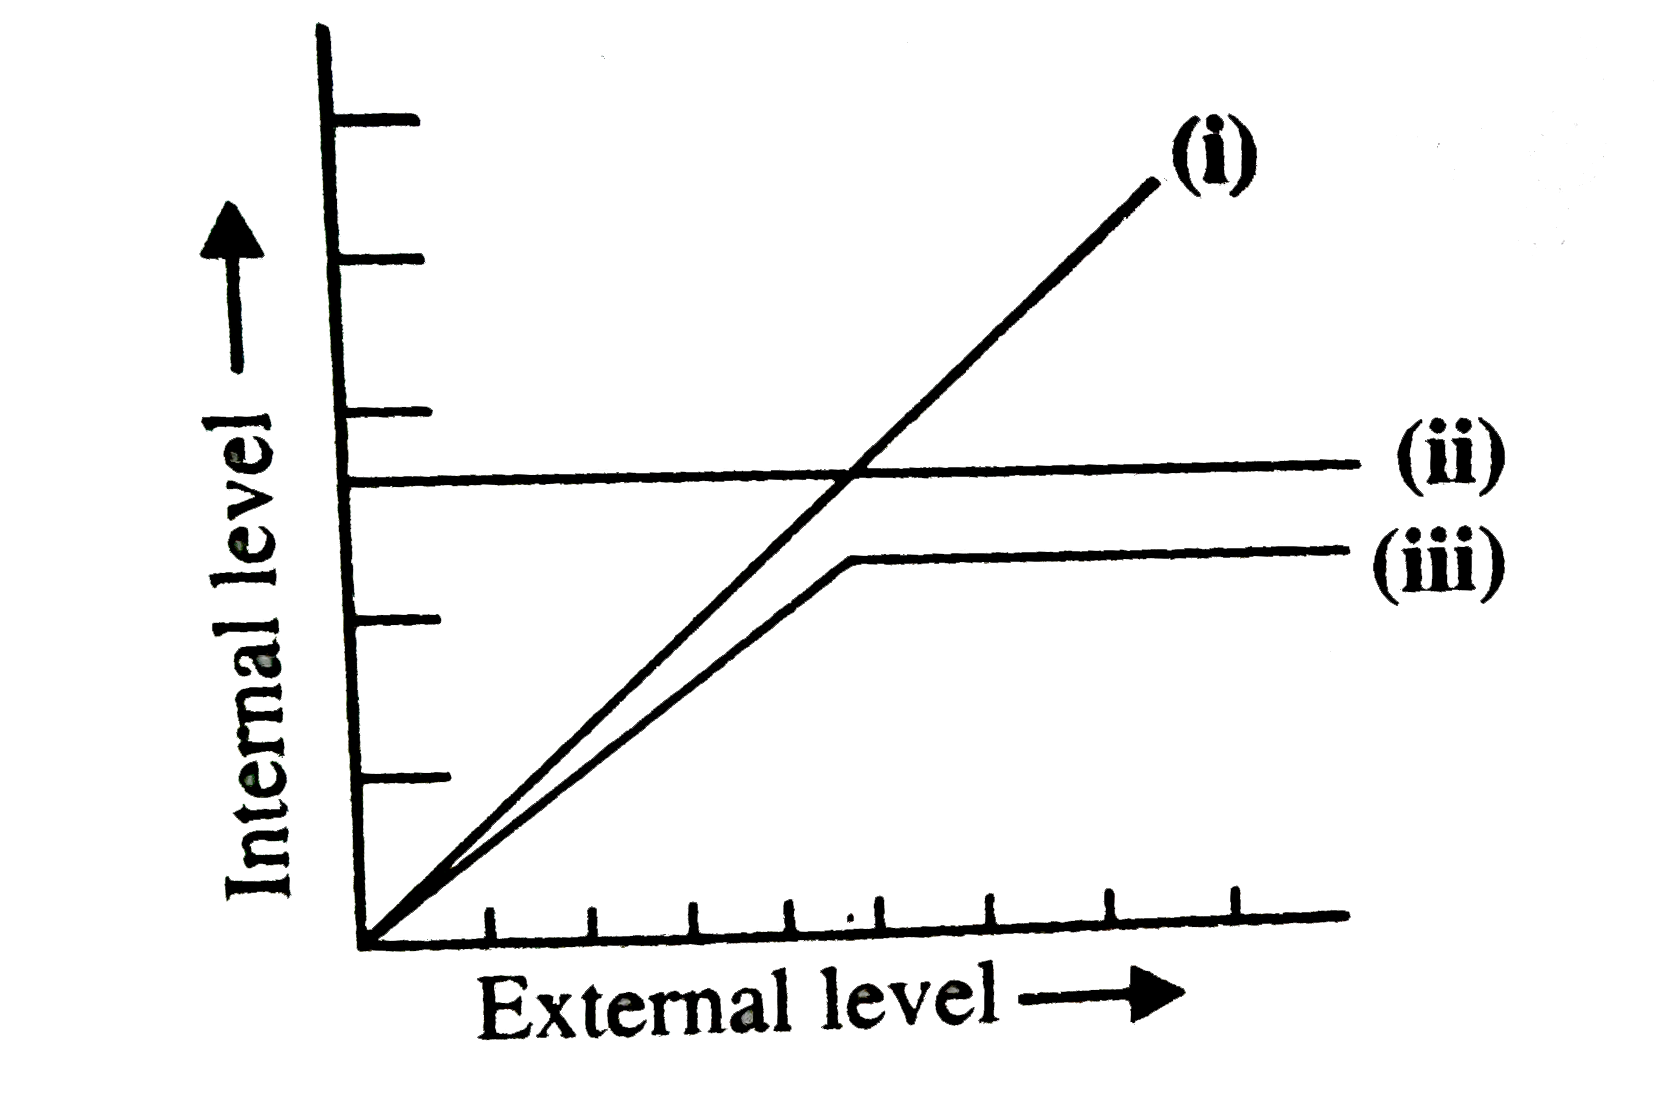 A(i)(ii)(iii).ConformersRegulatorsPartial regulatorsB(i)(ii)(iii).RegulatorsPartial regulatorsConformersC(i)(ii)(iii).Partial regulatorsRegulatorsConformersD(i)(ii)(iii).RegulatorsConformersPartial regulators
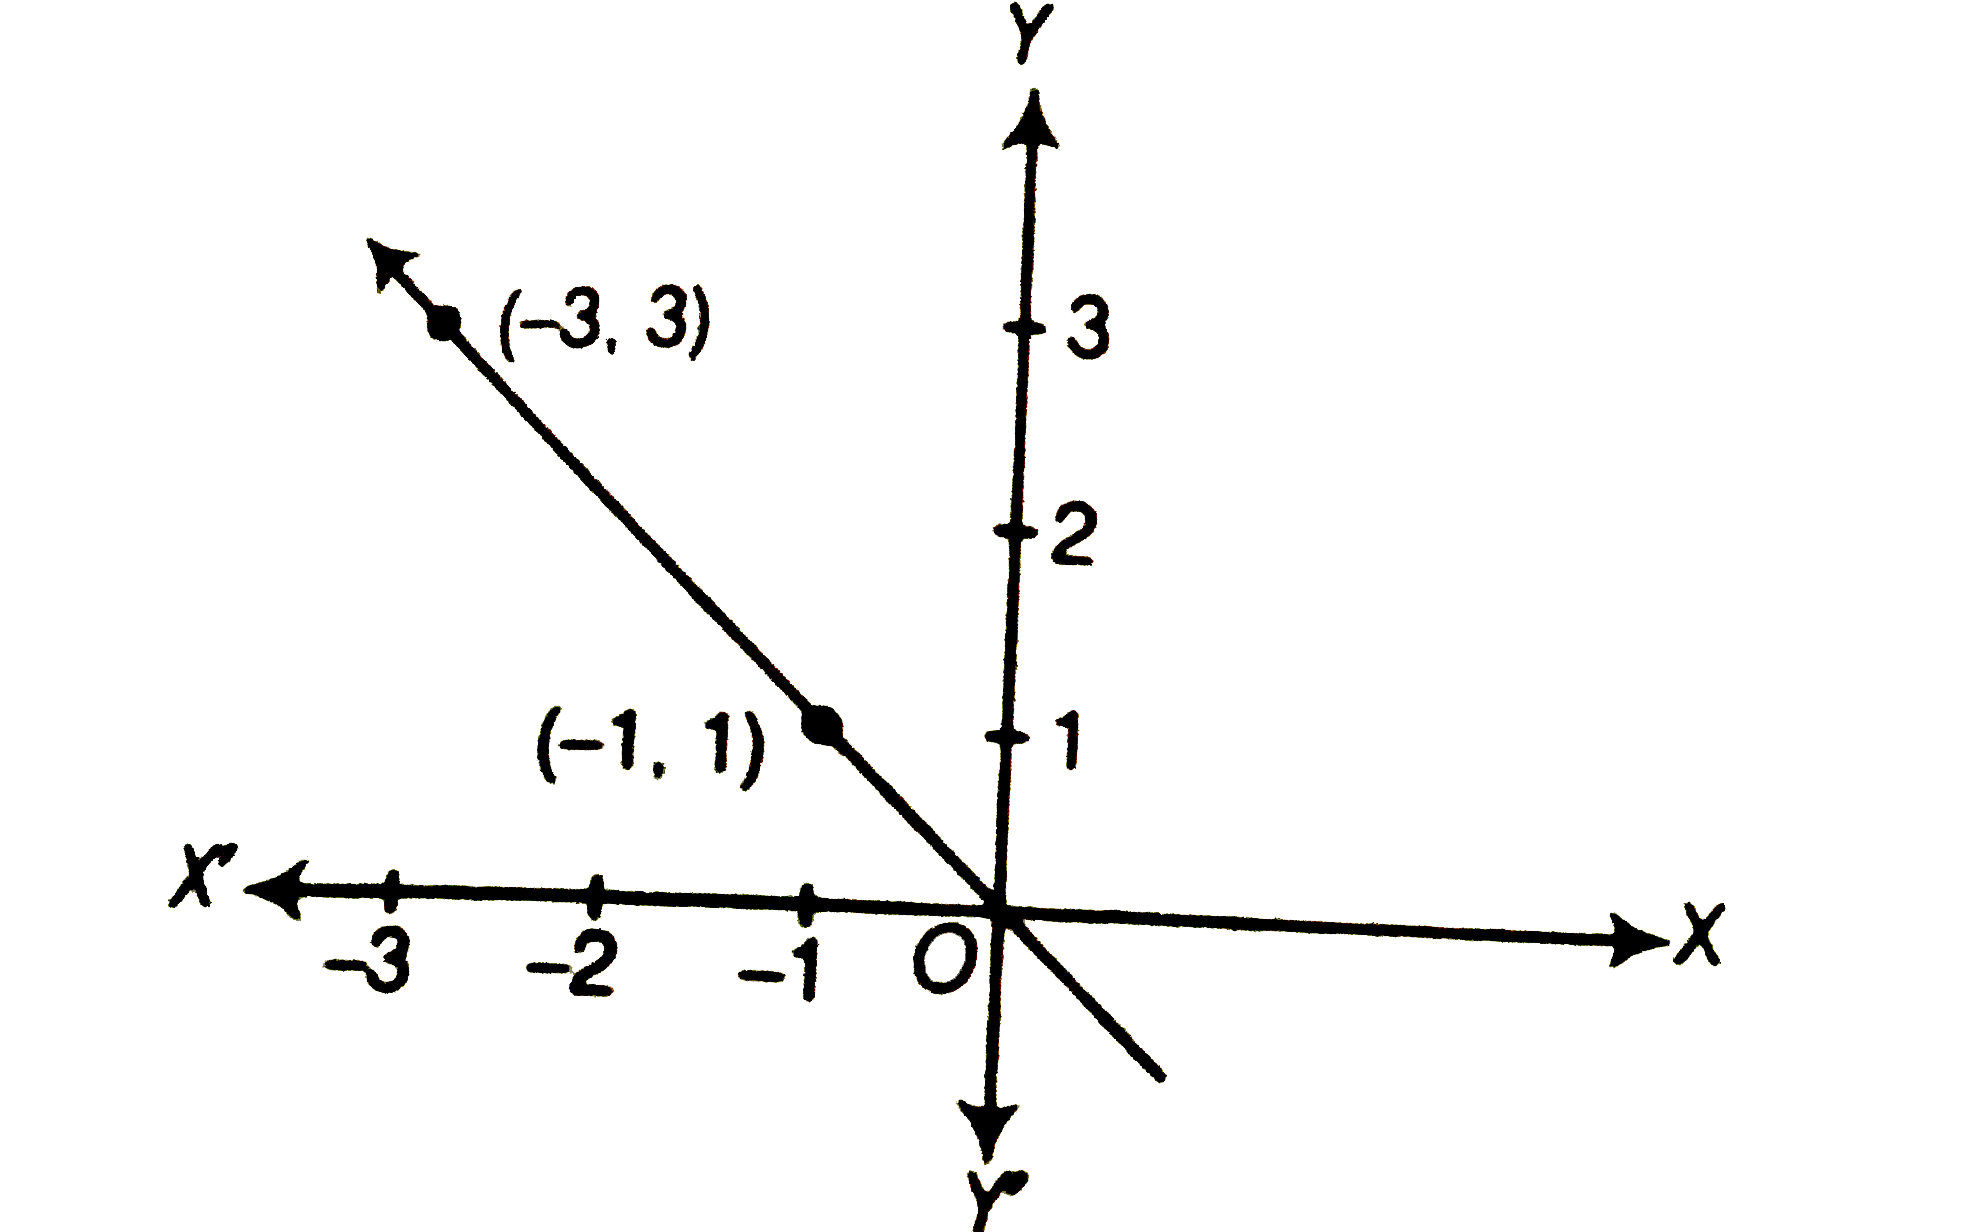
The graph given below represents the linear equation x+y=0.
 View Solution
The graph represented by x=sin2t,y=2cost is
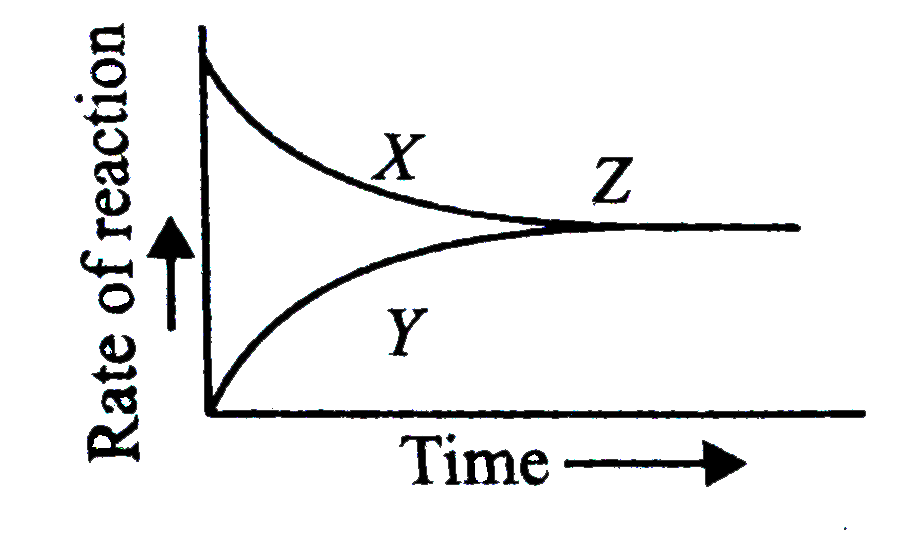
View SolutionStudy the given figure and label X,Y, and Z.
 View Solution
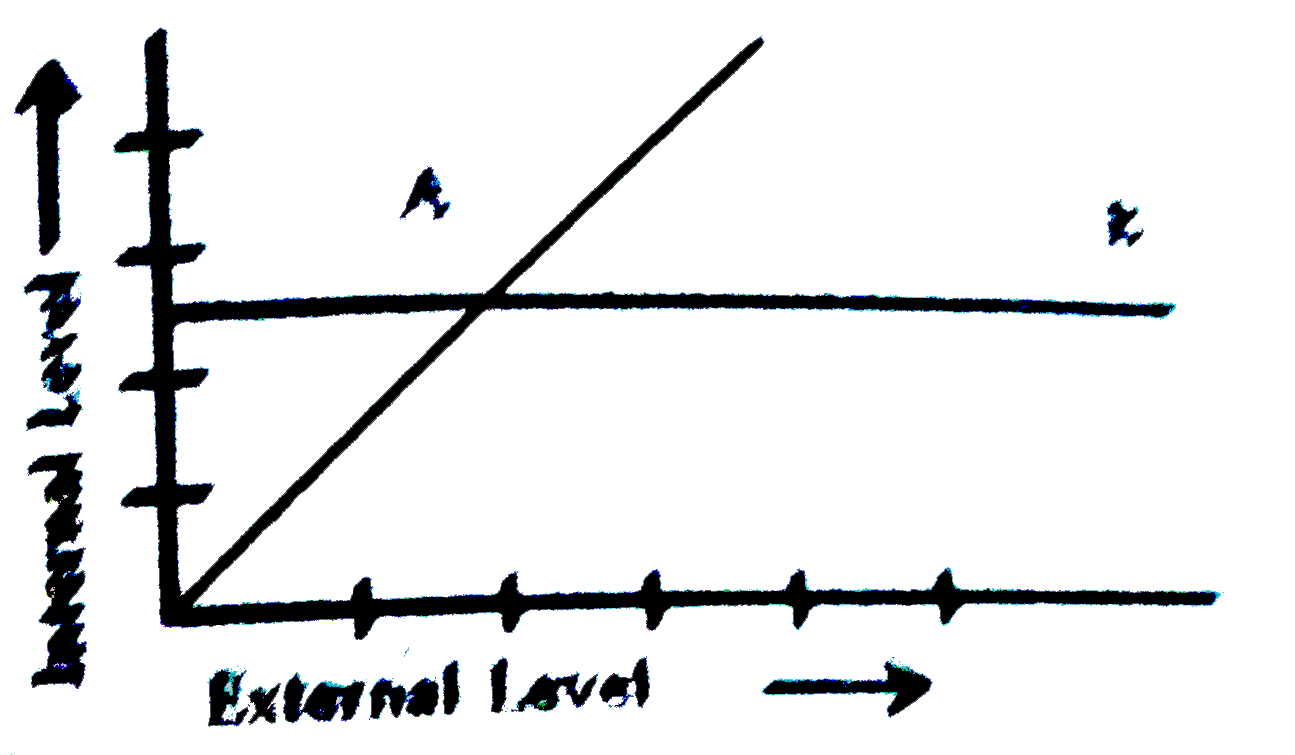
(a) The graph given below represents the organisms response to temperature as an environmental condition.
(i) Which one of the two lines represents conformers and why ?
(ii) What does the other line in the graph represent and why ?
(b) Mention the different adaptations the parasites have evolved with, to be able to successfully complete their life cycles in their hosts.
 View Solution
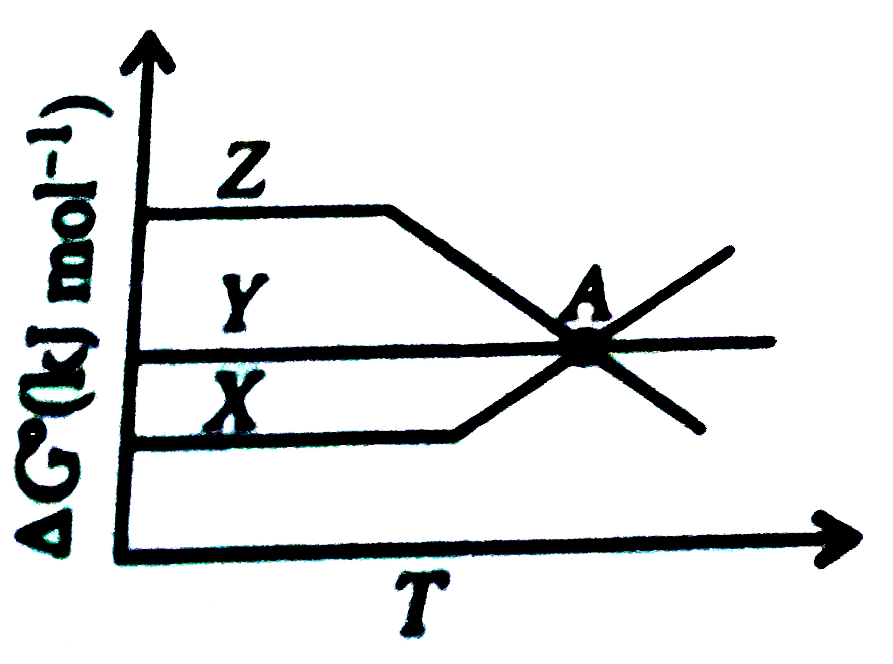
In the following Ellingham diagram ,X, Y and Z represent graphs for metal oxides . Select the correct option before point A.
 View Solution


