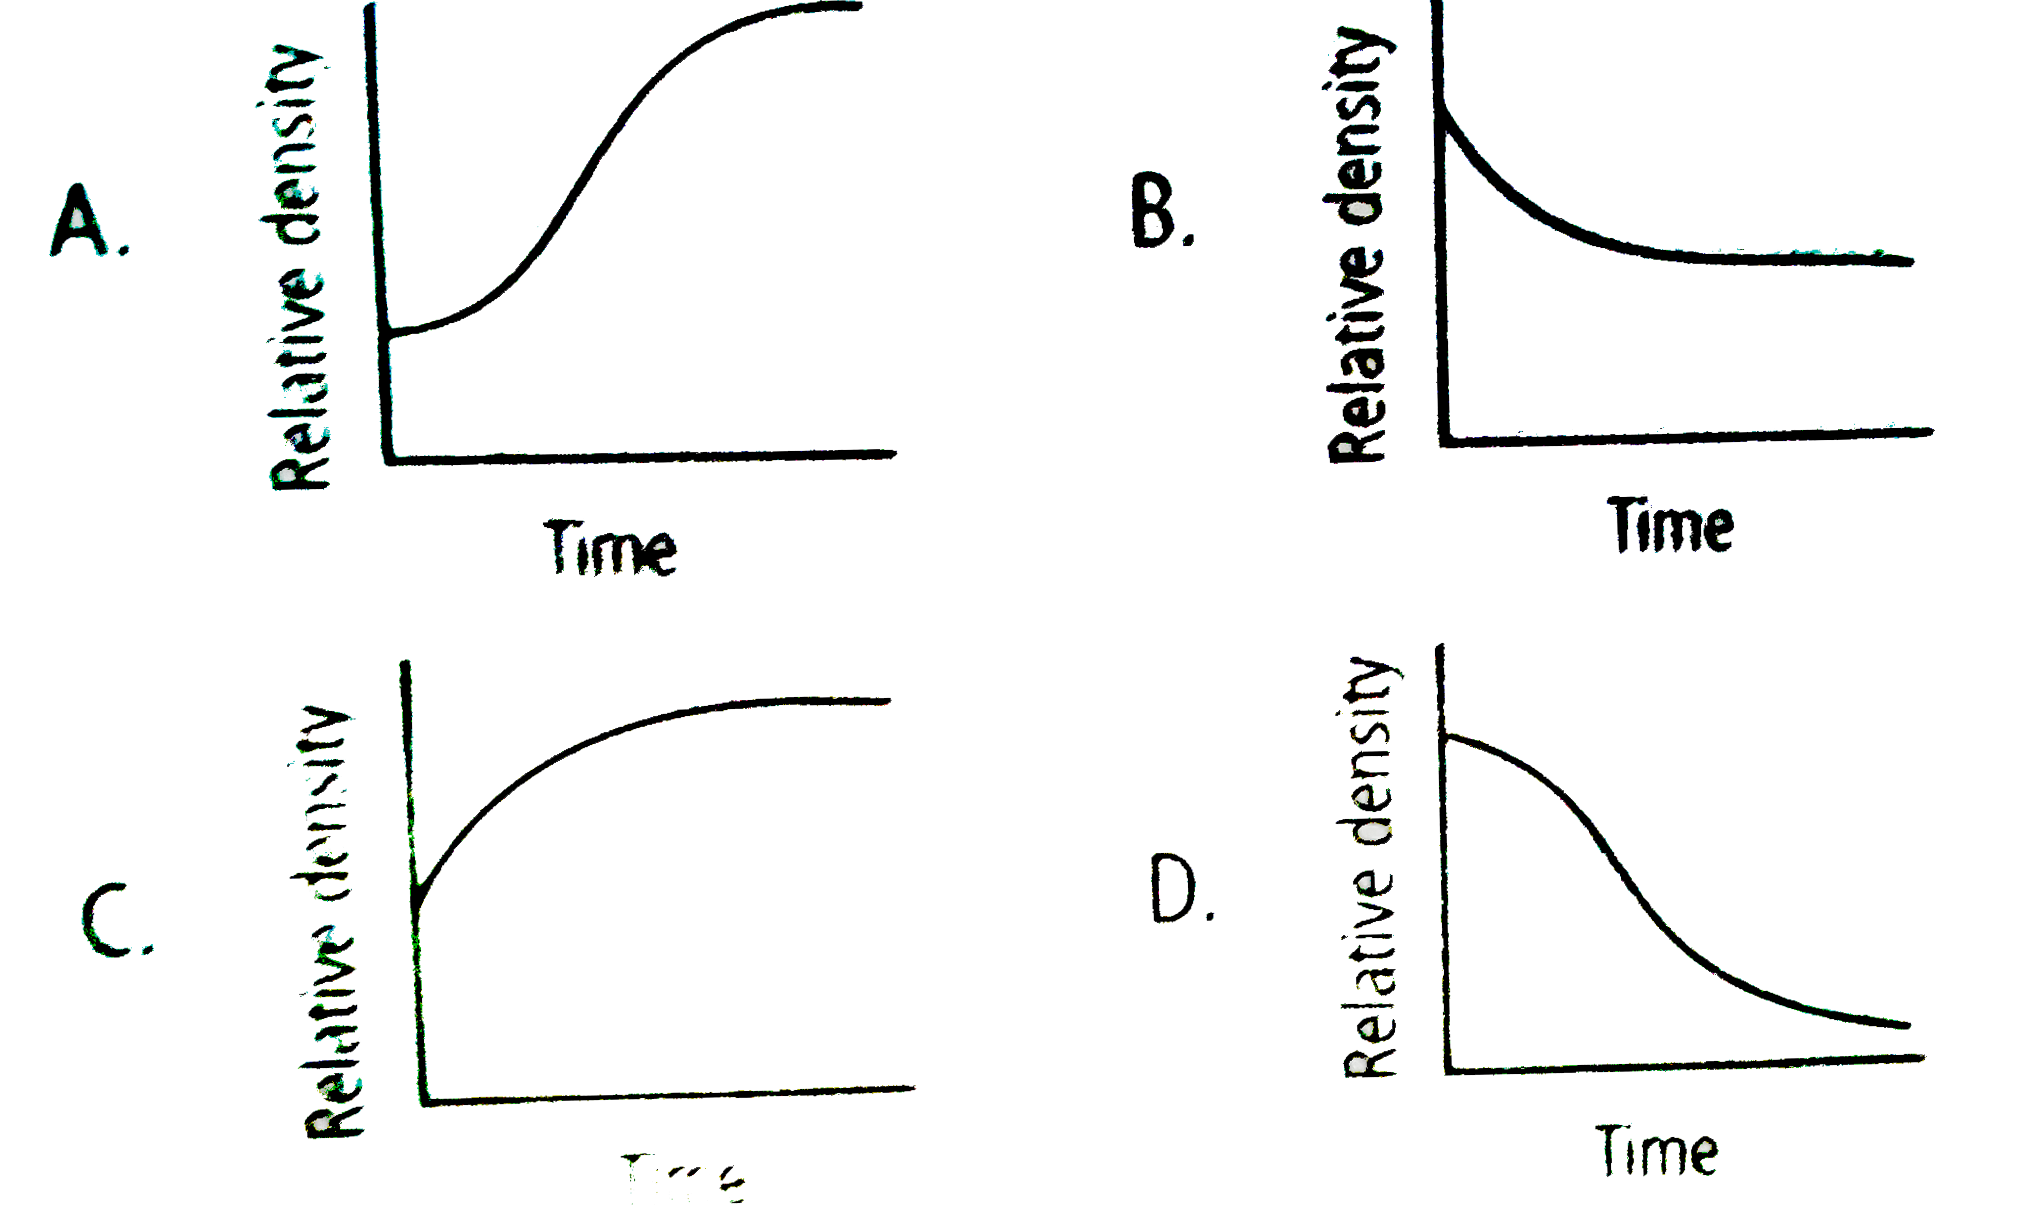
The relationship between population density (Nt) and population growth rate (R=Nt+1lNt) in a certain animal species is shown below.
![The relationship between population density (N(t)) and population growth rate (R = N(t+1) l N(t)) in a certain animal species is shown below. Choose from the following graphs the appropriate populations growth patterns that would be obtained if the population is at the densities (I, II, III) shown in the graph above. [Note : THe y-axis in A to D is relative density that cannot be compared to the absolute density in the figure]](https://d10lpgp6xz60nq.cloudfront.net/physics_images/NCERT_FING_BIO_OBJ_XII_OP_C13_E01_138_Q01.png)
Choose from the following graphs the appropriate populations growth patterns that would be obtained if the population is at the densities (I, II, III) shown in the graph above. [Note : THe y-axis in A to D is relative density that cannot be compared to the absolute density in the figure]

I−A,II−B,III−C
I−D,II−C,III−B
I−B,II−C,III−D
I−C,II−A,III−B
The correct Answer is:B
Step by step video, text & image solution for The relationship between population density (N_(t)) and population growth rate (R = N_(t+1) l N_(t)) in a certain animal species is shown below. Choose from the following graphs the appropriate populations growth patterns that would be obtained if the population is at the densities (I, II, III) shown in the graph above. [Note : THe y-axis in A to D is relative density that cannot be compared to the absolute density in the figure] by Biology experts to help you in doubts & scoring excellent marks in Class 12 exams.
Topper's Solved these Questions
- BOOK - NCERT FINGERTPS ENGLISHCHAPTER - ORGANISMS AND POPULATIONEXERCISE - NCERT20videos
ORGANISMS AND POPULATION
- BOOK - NCERT FINGERTPS ENGLISHCHAPTER - ORGANISMS AND POPULATIONEXERCISE - Assertion & Reason15videos
ORGANISMS AND POPULATION
- BOOK - NCERT FINGERTPS ENGLISHCHAPTER - ORGANISMS AND POPULATIONEXERCISE - Organisms And Population175videos
ORGANISMS AND POPULATION
- BOOK - NCERT FINGERTPS ENGLISHCHAPTER - MOLECULAR BASIS OF INHERITANCEEXERCISE - Molecular Basis Of Inheritance151videos
MOLECULAR BASIS OF INHERITANCE
- BOOK - NCERT FINGERTPS ENGLISHCHAPTER - PRACTICE PAPERSEXERCISE - Practice paper150videos
PRACTICE PAPERS
Similar Questions
Knowledge Check
- Question 1 - Select One
Exponential population growth is
AdN/dt = rNBdt/dN = rNCdN/rN = dtDrN/d N = dt
What is a zero population growth rate?
View SolutionExplain the following terms:
Growth rate of populationView SolutionHuman population growth in India.
View SolutionHuman population growth in India.
View SolutionPopulation growth rate depends upon
View SolutionPopulation growth rate depends upon
View SolutionExplain exponential population growth.
View Solution

