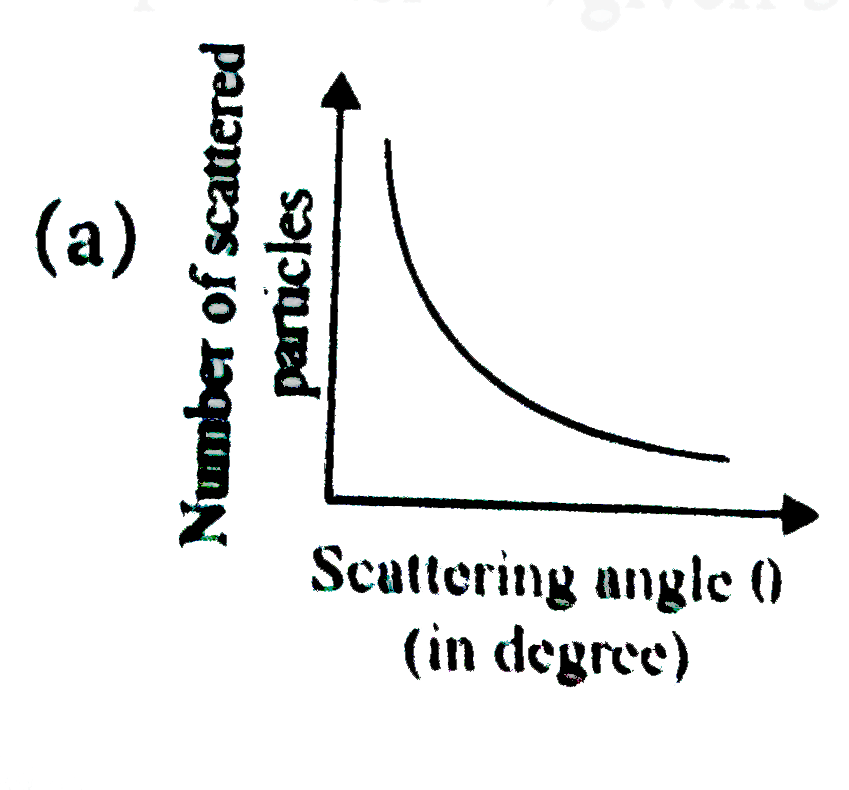
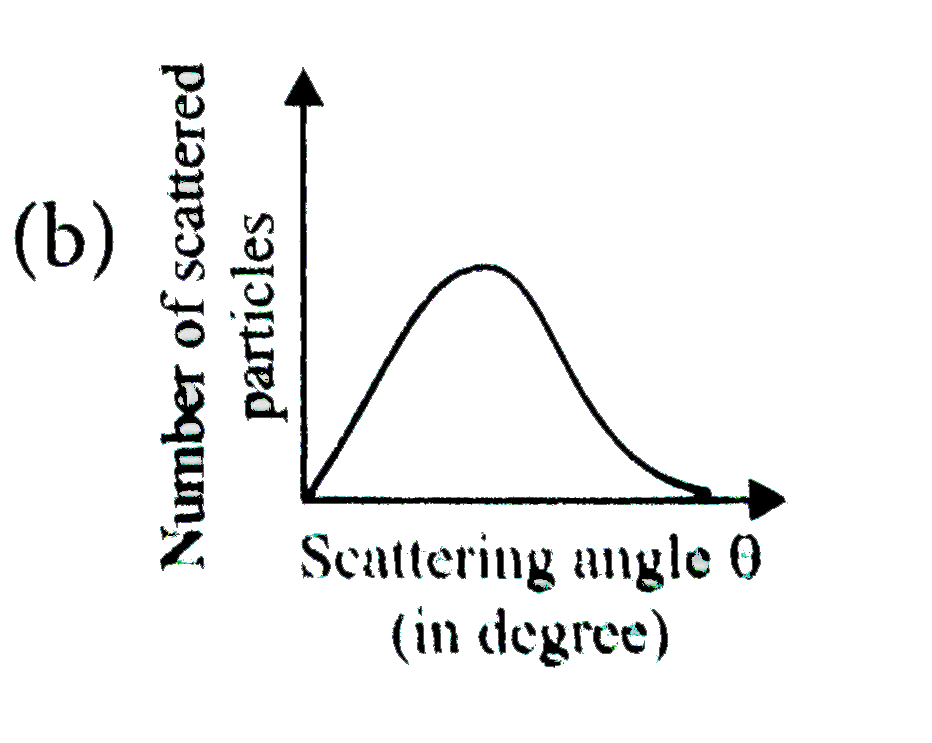
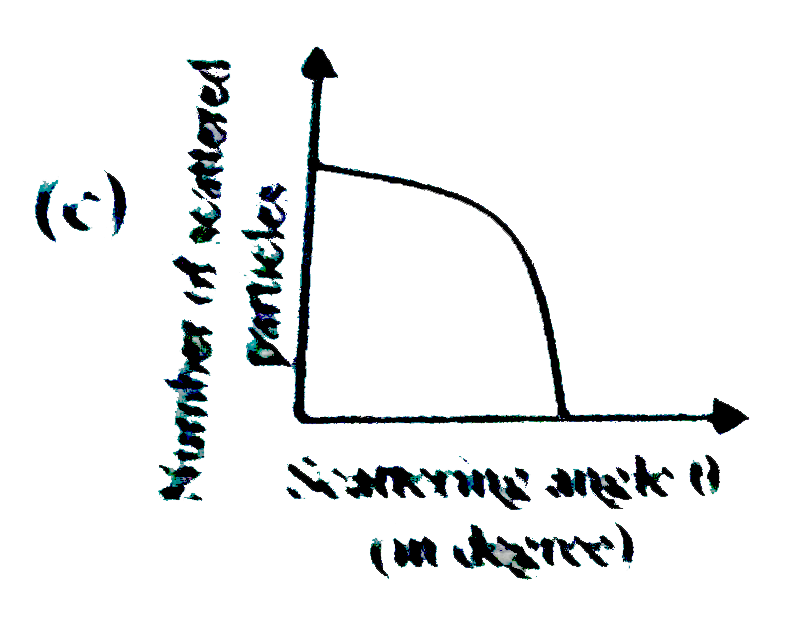
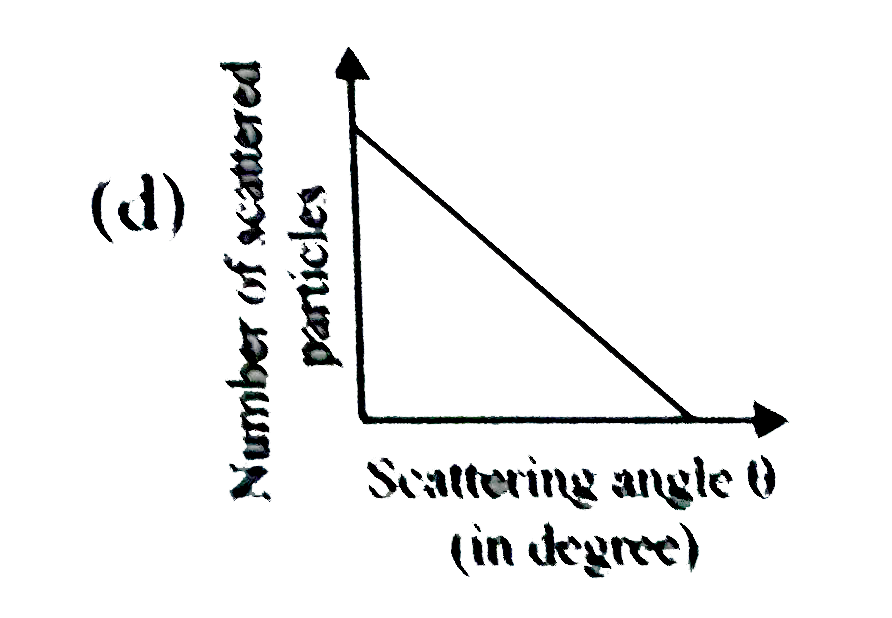
The graph of the total number of α-particles scattered at different angles in a given interval of time for α- particles scattering in the geiger- marsden experiment is given by


The correct Answer is:A
To solve the question regarding the graph of the total number of alpha particles scattered at different angles in the Geiger-Marsden experiment, we can follow these steps:
Step 1: Understand the Geiger-Marsden Experiment
The Geiger-Marsden experiment, also known as the Rutherford gold foil experiment, was designed to probe the structure of the atom. In this experiment, alpha particles were directed at a thin foil of gold, and the scattering of these particles was observed.
Step 2: Identify the Variables
In the context of the question:
- The x-axis represents the scattering angle (θ).
- The y-axis represents the total number of alpha particles scattered.
Step 3: Analyze the Scattering Pattern
From the experiment, we know that:
- At small angles (close to 0°), a large number of alpha particles are scattered.
- As the angle increases, the number of scattered alpha particles decreases initially.
- At larger angles, there is a small increase in the number of particles scattered due to a few particles scattering at larger angles.
Step 4: Graph Characteristics
Based on the above analysis, the graph will show:
- A decrease in the number of scattered particles for small angles.
- A minimum point followed by an increase in the number of scattered particles at larger angles.
Step 5: Choose the Correct Graph
Among the given options, we need to find a graph that reflects this behavior:
- The correct graph will start high at small angles, decrease to a minimum, and then increase again.
Conclusion
The graph that best represents the scattering of alpha particles in the Geiger-Marsden experiment is the one that shows a decrease followed by an increase in the number of scattered particles as the scattering angle increases. Therefore, the correct option is Option A.
---
The Geiger-Marsden experiment, also known as the Rutherford gold foil experiment, was designed to probe the structure of the atom. In this experiment, alpha particles were directed at a thin foil of gold, and the scattering of these particles was observed.
In the context of the question:
- The x-axis represents the scattering angle (θ).
- The y-axis represents the total number of alpha particles scattered.
From the experiment, we know that:
- At small angles (close to 0°), a large number of alpha particles are scattered.
- As the angle increases, the number of scattered alpha particles decreases initially.
- At larger angles, there is a small increase in the number of particles scattered due to a few particles scattering at larger angles.
Based on the above analysis, the graph will show:
- A decrease in the number of scattered particles for small angles.
- A minimum point followed by an increase in the number of scattered particles at larger angles.
Among the given options, we need to find a graph that reflects this behavior:
- The correct graph will start high at small angles, decrease to a minimum, and then increase again.
The graph that best represents the scattering of alpha particles in the Geiger-Marsden experiment is the one that shows a decrease followed by an increase in the number of scattered particles as the scattering angle increases. Therefore, the correct option is Option A.
Topper's Solved these Questions
- BOOK - NCERT FINGERTPS ENGLISHCHAPTER - ATOMS EXERCISE - Higher order thinking skills8videos
ATOMS
- BOOK - NCERT FINGERTPS ENGLISHCHAPTER - ATOMS EXERCISE - NCERT Examplar problems7videos
ATOMS
- BOOK - NCERT FINGERTPS ENGLISHCHAPTER - ALTERNATING CURRENT EXERCISE - Assertion And Reason15videos
ALTERNATING CURRENT
- BOOK - NCERT FINGERTPS ENGLISHCHAPTER - COMMUNITCATION SYSTEMSEXERCISE - Assertion And Reason30videos
COMMUNITCATION SYSTEMS
Similar Questions
Knowledge Check
- Question 1 - Select One
The area under velocity-time graph for a particle in a given interval of time represnets
AvelocityBaccelerationCwork doneDDisplacement does not tell the nature of the actual motion of a particle between the points.
The path of the scattered α – particles is
View SolutionEnergy of the beam of α-particles used by Geiger and Marsden in scattering experiment is
View SolutionThickness of the foil of gold used in α-particle scattering experiment is
View SolutionRutherford's alpha(α) particles scattering experiment resulted into discovery of
View SolutionThe magintude of displacemnt is equal to the distance coverd in a given interval of time if the particle .
View SolutionFrom the alpha - particle scattering experiment Rutherford concluded that
View SolutionThe number of α-particless scattered per unit area N (θ) at scattering angle θ varies inversely as
View Solution

