Consider the given diagram for 1 mole of a gas X and answer the following question.
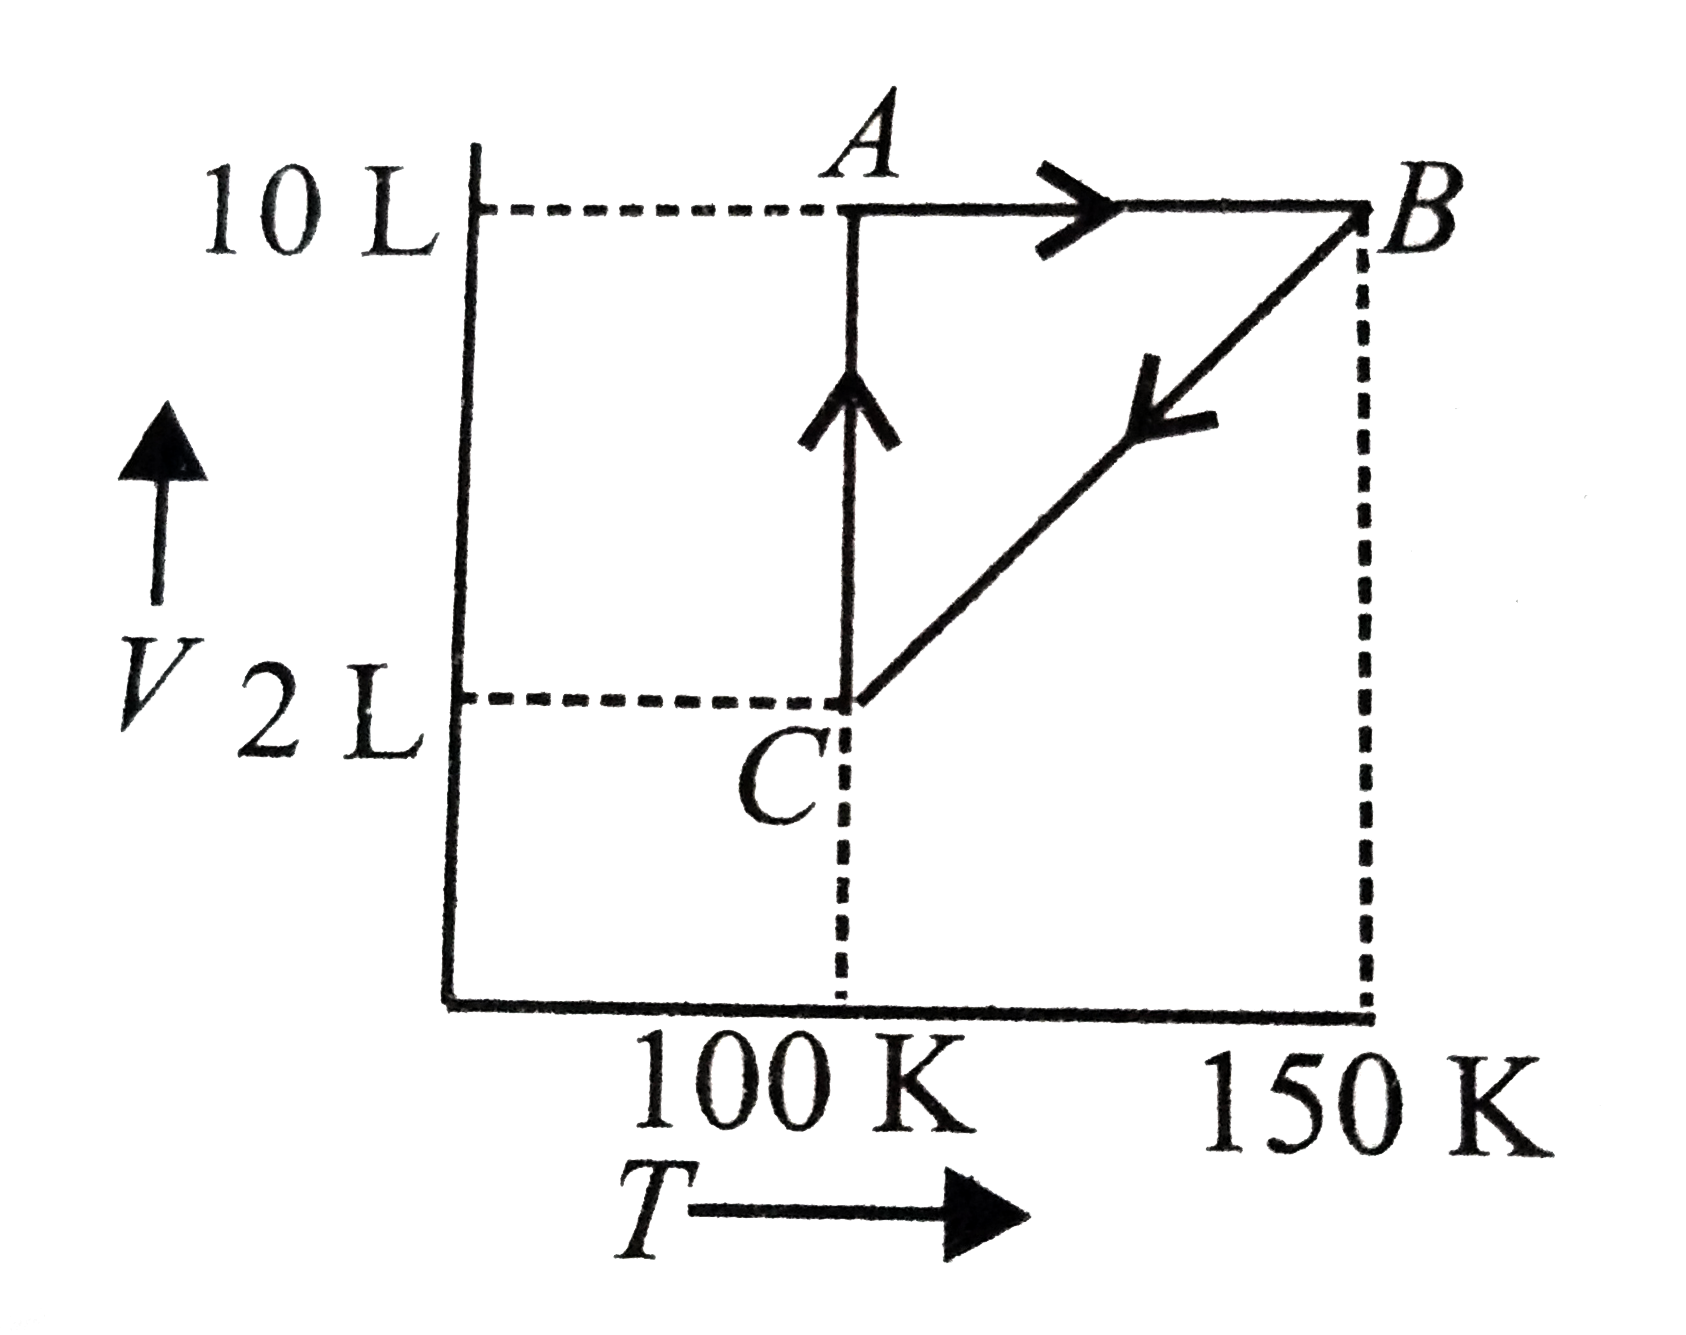
The process A→B represents
isobaric change
isothermal change
adiabatic change
isochoric change.
The correct Answer is:D
There is no change in volume from A→B
Topper's Solved these Questions
- THERMODYNAMICSBOOK - NCERT FINGERTPS ENGLISHCHAPTER - THERMODYNAMICSEXERCISE - Enthalpy Change Of A Reaction
13 Videos
- THERMODYNAMICSBOOK - NCERT FINGERTPS ENGLISHCHAPTER - THERMODYNAMICSEXERCISE - Enthalpies For Different Type Of Reaction
22 Videos
- THERMODYNAMICSBOOK - NCERT FINGERTPS ENGLISHCHAPTER - THERMODYNAMICSEXERCISE - Thermodynamic Terms
3 Videos
- THE S-BLOCK ELEMENTSBOOK - NCERT FINGERTPS ENGLISHCHAPTER - THE S-BLOCK ELEMENTSEXERCISE - Assertion And Reason
15 Videos
Similar Questions
Knowledge Check
Identify A in the given diagram.
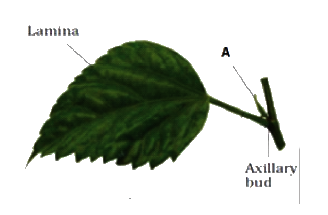 Acellular endospermBnuclear endospermChelobial endospermDreminate endosperm
The diagram given below is an experiment conducted to study a factor necessary for photosynthesis Observe the diagram and then answer the following questions
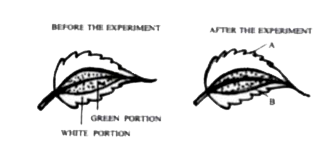
Give a balanced chemical equation to represent the process of photosynthesis
View SolutionConsider the following energy level diagram:
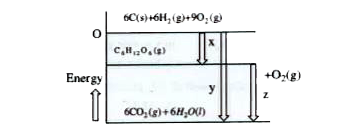
Answer the following question on the basis of the given diagram
In the given diagram z refers to
View SolutionConsider the following energy level diagram:
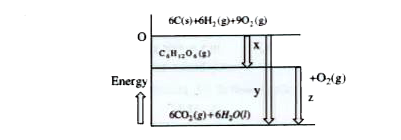
Answer the following question on the basis of the given diagram
The heat of formation of glucose is
View SolutionThe figure given below represents an experimental setup with a weighing machine to demonstrate a particular process in plants. The experimental set -up was placed in bright sunlight. Study the diagram and answer the following questions :
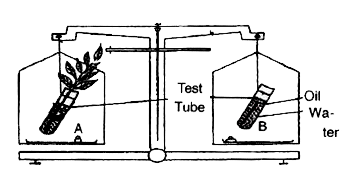
Name the process intended for study.
View SolutionGiven below is a diagram depicting a physiological process in man.
Study the same and answer the following questions :
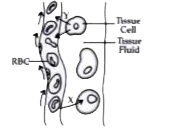
Name the process occurring in the diagram.
Explain the process mentioned in part (i).
View SolutionGiven below is a diagram depicting a physiological process in mammals. Study the same and answer the following questions :
(i)Name the process occurring in the diagram.
(ii)Explain the process mentioned in part (i).
View SolutionConsider the following energy level diagram:
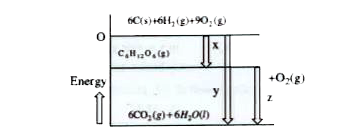
Answer the following question on the basis of the given diagram
The quantity y is equal to
View Solution

