Describe species area relationships.
Text Solution
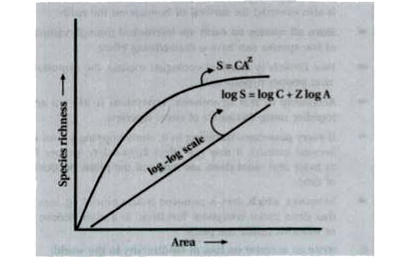
The great German naturalist and geographer Alexander Von Humboldt during his pioneering and extensive explorations in the wilderness of South American jungles observed that within a region species richness increased with increasing explored area but only up to a limit.
In fact the relation between species richness and area for a wide variety of taxa [angiosperm plants, birds, bats, fresh water fishes] turns out to be a rectangular hyperbola.

On a logarithmic scale, the relationship is a straight line described by the equation
logS=logC+ZlogA
Where
S=Species richness
V = Area
Z = Slope of the line [regression co-efficient]
C = Y-intercept
Ecologists have discovered that the value of Z lines in the range of 0.1 to 0.2, regardless of the taxomomic group or the region [whether it is the plants in Britain, birds in California or molluscs in New York state, the slopes of the regression line are amazingly similar.]
But if we analyse the species area relationship among very large areas like the entire continents we will find that the slope of the line to be much steeper [Z values in the range of 0.6 to 1.2.]
For example for frugivorous [fruit eating] birds and mammals in the tropical forests of different continents, the slope is found to be 1.15.
|
Topper's Solved these Questions
- BIODIVERSITY AND CONSERVATIONBOOK - KUMAR PRAKASHANCHAPTER - BIODIVERSITY AND CONSERVATIONEXERCISE - SECTION - B (DIFFERENCE/SCIENTIFIC REASONS)
7 Videos
- BIODIVERSITY AND CONSERVATIONBOOK - KUMAR PRAKASHANCHAPTER - BIODIVERSITY AND CONSERVATIONEXERCISE - SECTION - C (OBJECTIVE QUESTIONS - ANSWERS)
19 Videos
- BIOTECHNOLOGY : PRINCIPLES AND PROCESSESBOOK - KUMAR PRAKASHANCHAPTER - BIOTECHNOLOGY : PRINCIPLES AND PROCESSESEXERCISE - SECTION - F (MCQs ASKED IN COMPETITIVE EXAM)
78 Videos
Similar Questions
Knowledge Check
The hyperbolic equation for the species area relationship is
ALogC=logS+SlogABLogS=logC+ZlogACLogS=logA+ZlogCDS=CAzAccording to the concept of species-area relationship.
AThe number of species in an area increase with the size of the area.BThe value of Z lies in the range of 0.3 to 0.4, regardless of the taxonomic group or the region.CThe relationship is for a rectangular hyperbola curve is described by the equation logS=logC+ZlogA.DThe larger the area the greater the extinction rate.On a logarithmic scale the correct representation of species area relationship is represented by the equation
ALogS=LogC−ZLogABLogS=LogC+ZLogACLogA=LogC+ZLogSDLogS=LogA+ZLogC
The hyperbolic equation for the species area relationship is
View SolutionWhich of the following equation correctly represent species-area relationship?
View SolutionOn a logarithmic scale the correct representation of species area relationship is represented by the equation
View SolutionWhich of the following equation correctly represent species-area relationship?
View SolutionWhich of the following statements about species-area relationships and their consequences for extinction rates is false?
View Solution
