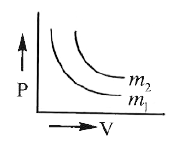
The graph drawn between presure and volume in boyles law experiment is shown in figure for different masses of same gas at same temperature then
 Solution in Telugu
m2>m1
m1>m2
m1=m2
m31=m2
The correct Answer is:A
Step by step video, text & image solution for The graph drawn between presure and volume in boyles law experiment is shown in figure for different masses of same gas at same temperature then by Physics experts to help you in doubts & scoring excellent marks in Class 11 exams.
Updated on:21/07/2023Similar Questions
At 300 K temperature, presure and volume of gas is 1 bar and 10 L respectively. If pressure becomes 2 bar then calculate volume of gas at same temperature.
View SolutionTwo different at constant. The relationship between volume V and the pressure P at a given temperature of same ideal gas are shown for masses m_1 and m_2 of the gas respectively. Then
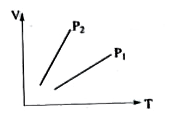
View SolutionFigure shows the volume versus temperature graph for the same mass of a gas (assumed ideal correspond to two different pressure P1andP2. Then

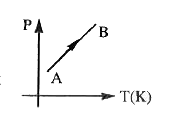
View SolutionThe P-T graph for the given mass of an ideal gas is shown in figure. Then the volume

View SolutionThe grnph drawn between presure and volume in boyles law experiment is shown in figure for different molecular weights then
View SolutionIn Boyles experiment for a given gas at different temperatures the graph drawn between pressure and density are straight lines as shown then
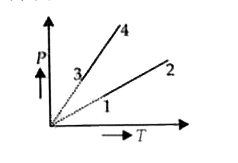
View Solutionकिसी आदर्श गैस के विभिन्न आयतनों के मोलों की समान संख्या के दाब-ताप ग्राफ को चित्र में दिखाए गए अनुसार आरेखित किया गया है। सही विकल्प को चुनिए।

View Solution
