The strain stress curves of three wires of different material as shown in fig. A,B,C are the elastic limits of the wire. The figure show that
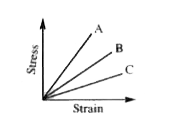
Elasticity of wire A is maximum
Elasticity of wire B is maximum
Elasticity of wire C is maximum
None of the above is true
The correct Answer is:1
Similar Questions
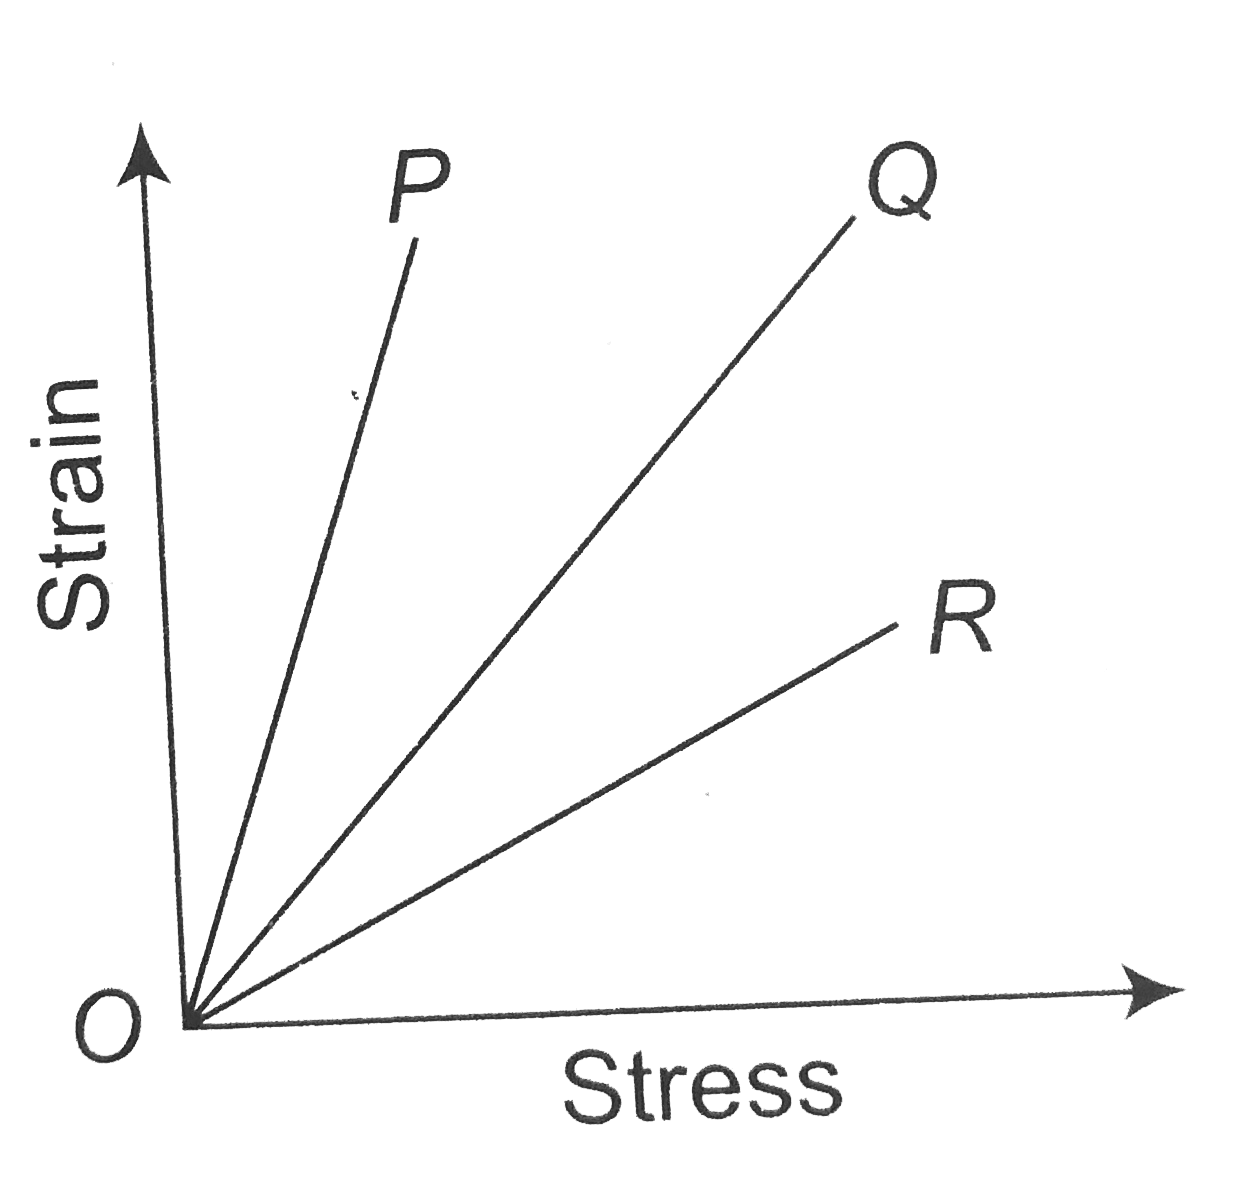
The strain stress curves of three wires of different materials are shown in the figure. P, Q and R are the elastic limits of the wires. The figure shown that
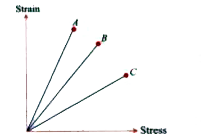
View SolutionStress - strain graph of three different are as shown. A,B and C are the Young's modulus of the wires. Which of the following statement is correct ?
View Solution
Knowledge Check
The stain-stress curves of three wires of different material are showm in the figure P,Q,R are the elastic limits of the wires, the figure shows that
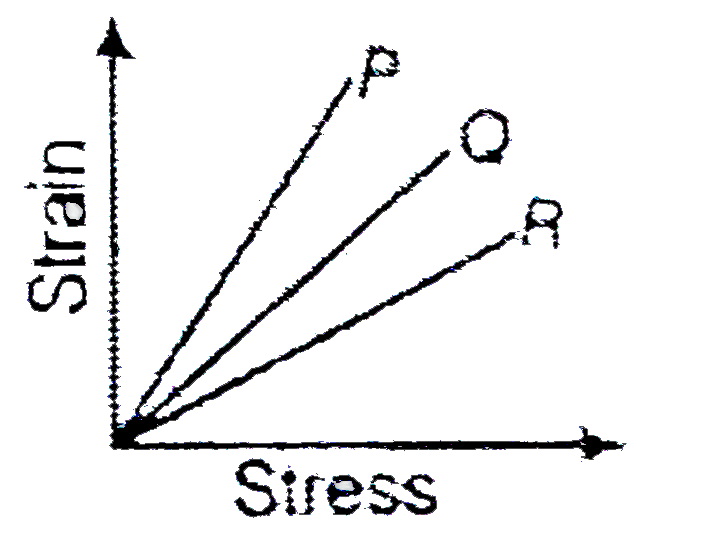 Aelasticity of wire P is maximumBelasitcity of wire R is maximumCtensile strenght of R is maximumDNone the above
The strain-stress curves of three wires of different materials ar shown in the figure P,Q and R are the elastic limits of the wires. The figure shows that :
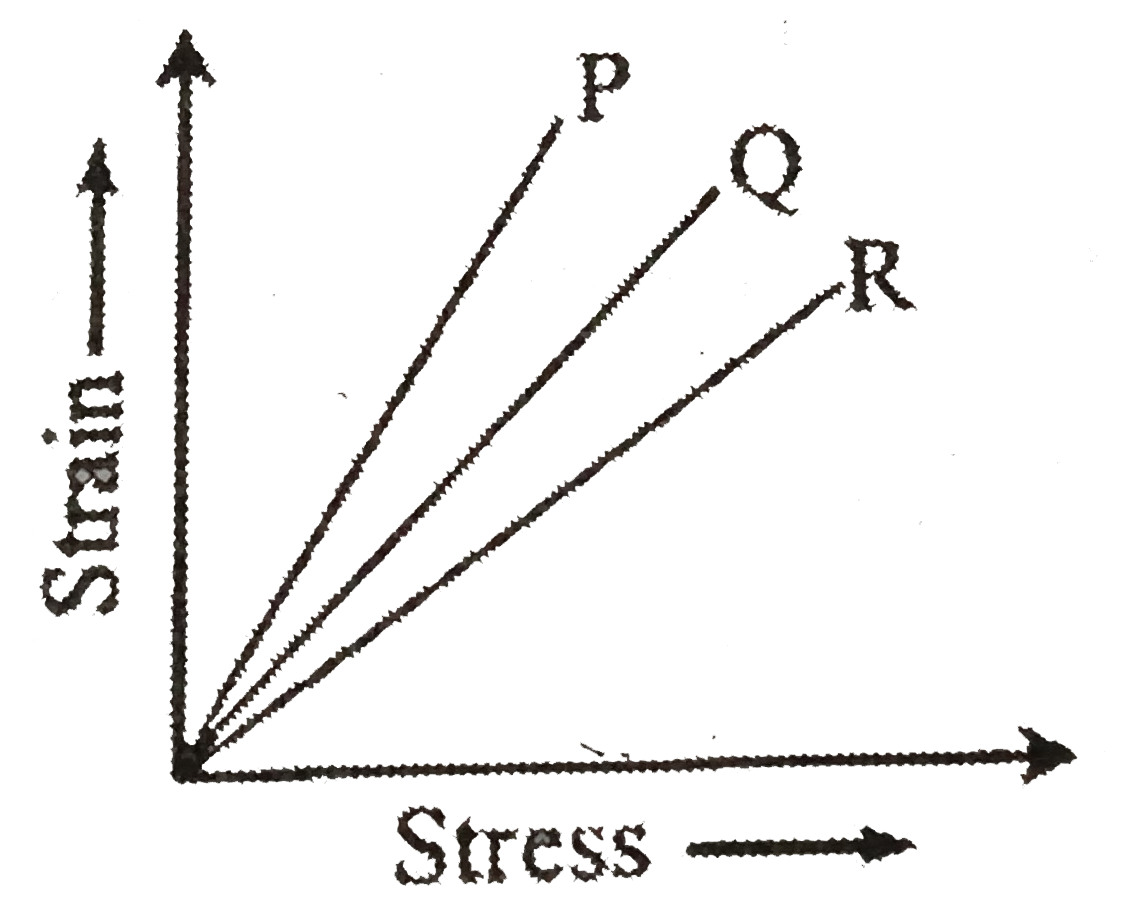 Aelasticity of wire P is maximumBelasticity of wire Q is maximumCtensile strength of R is maximumDnone of the above
The strain-stress curves of three wire of different materials are shown in the figure. P,Q and R are the elastic limits of the wires. The figures shows that
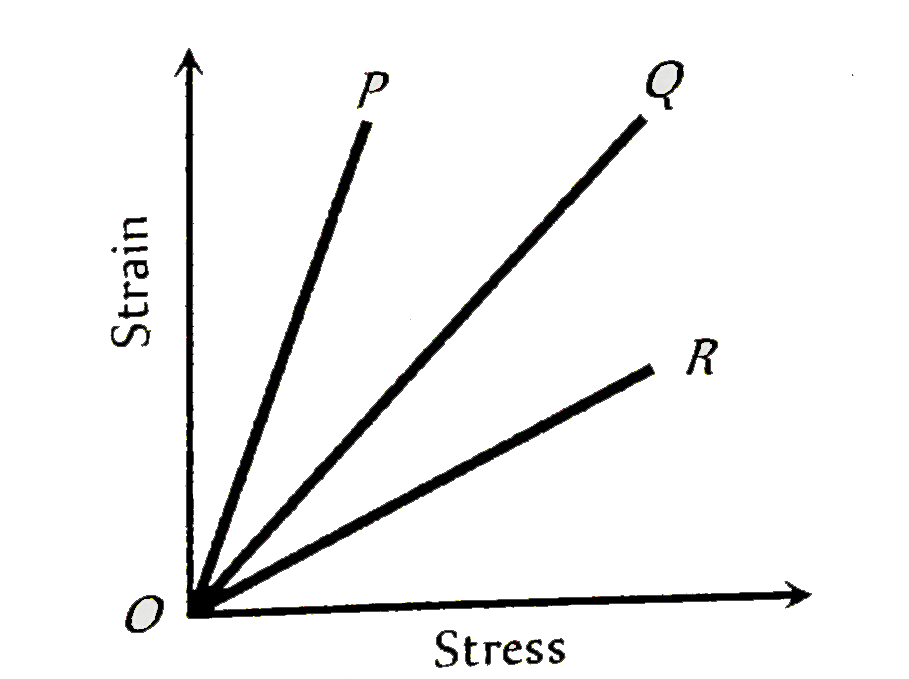 AElasticity of wire P is maximumBElastiity of wire Q is maximumCTensile strength of R is maximumDNone of the above is true
The stress versus strain graphs for wires of two materials A and B are as shown in the figure. If YAandYB are the younng's moduli of the materials, then
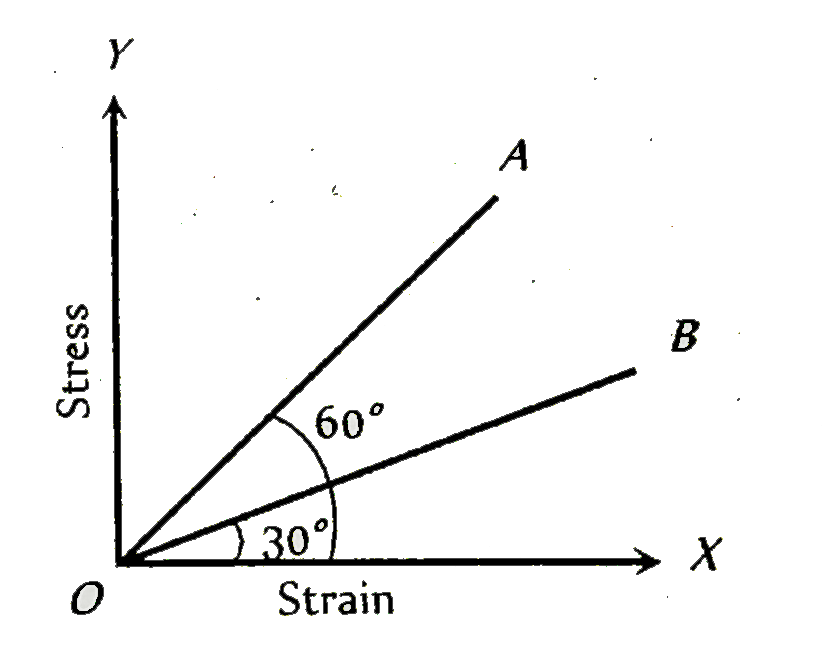
View SolutionThe stress versus strain graphs for wires of two materials A and B are as shown in the figure. If YAandYB are the younng's moduli of the materials, then

View Solution
The strain stress curves of three wires of different materials are shown in the figure. P, Q and R are the elastic limits of the wires. The figure shown that
View Solution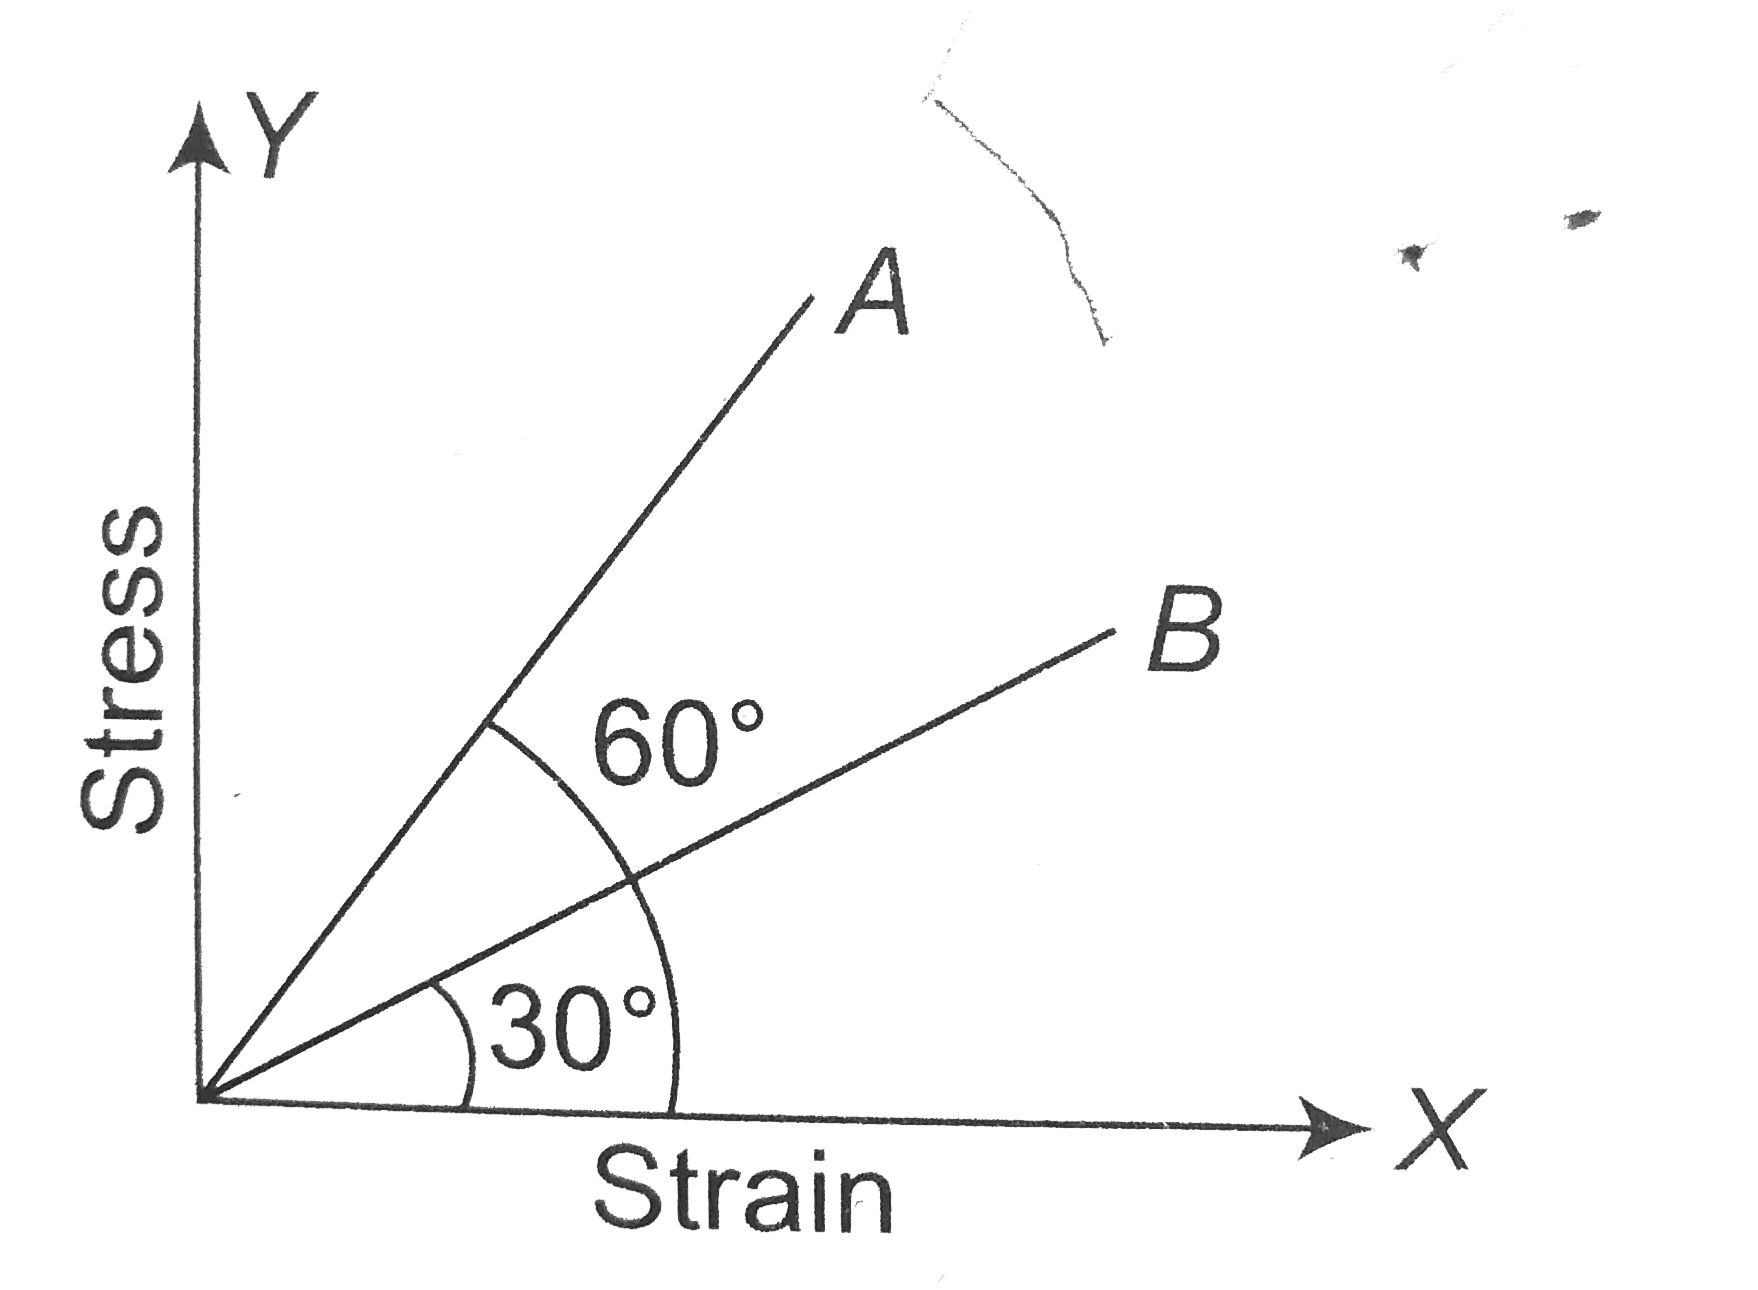
The stress versus strain graphs for wires of two materials A and B are as shown in the figure. If YA and YB are the Young's moduli of the materials then
View SolutionThe stress versus strain graphs for wires of two materials A and B are as shown in the figure. If YAandYB are the younng's moduli of the materials, then

View Solution
