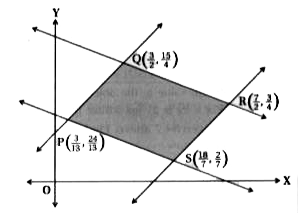
In Figure, the feasible region (shaded) for a LPP is shown. Determine the maximum and minimum value of z = x + 2y.
 Solution in Gujrati
The correct Answer is:Maximum and minimum value of objective function z = x + 2y is 9 and 317
Step by step video, text & image solution for In Figure, the feasible region (shaded) for a LPP is shown. Determine the maximum and minimum value of z = x + 2y. by Maths experts to help you in doubts & scoring excellent marks in Class 12 exams.
Updated on:21/07/2023Topper's Solved these Questions
- LINEAR PROGRAMMINGBOOK - KUMAR PRAKASHANCHAPTER - LINEAR PROGRAMMINGEXERCISE - MULTIPLE CHOICE QUESTIONS
42 Videos
- LINEAR PROGRAMMINGBOOK - KUMAR PRAKASHANCHAPTER - LINEAR PROGRAMMINGEXERCISE - PRACTICE PAPER - 12
14 Videos
- LINEAR PROGRAMMINGBOOK - KUMAR PRAKASHANCHAPTER - LINEAR PROGRAMMINGEXERCISE - TEXTBOOK ILLUSTRATIONS FOR PRACTICE WORK
11 Videos
- INVERSE TRIGONOMETRIC FUNCTIONSBOOK - KUMAR PRAKASHANCHAPTER - INVERSE TRIGONOMETRIC FUNCTIONSEXERCISE - PRACTICE PAPER - 2 (SECTION - D)
2 Videos
- MATRICES BOOK - KUMAR PRAKASHANCHAPTER - MATRICES EXERCISE - Practice Paper - 3 (Section - D)
1 Videos
Similar Questions
Solution set of the inequality 2x+y>5 is ………
View SolutionThe correct points of the feasible region determined by the following system of linear inequalities, 2x+y≤10,x+3y≤15,x,y≥0, are (0, 0), (5, 0), (3, 4) and (0, 5). Let Z = px + qy, where p,q>0. Condition on p and q so that the maximum of Z occurs at both (3, 4) and (0, 5) is ..........
View SolutionSolve the following linear programming problem graphically :
Maximise Z = 4x + y …(1)
subject to the constraints :
x+y≤50 …(2)
3x+y≤90…(3)"
x≥0,y≥0 ...(4)
View SolutionProve that :
cot−1(√1+sinx+√1−sinx√1+sinx−√1−sinx)=x2,x∈(0,π4)
View SolutionFor matrix A=⎡⎢⎣11112−32−13⎤⎥⎦ . Prove that , A3−6A2+5A+11I=0. Hence find A−1 using it .
View SolutionHow many lines of symmetry does the above figure have ?
View SolutionDetermine the point of symmetry of a regular hexagon.
View SolutionDtermine the images of the following figure about the given line :
View SolutionMatch the following Column A to Column B

View SolutionMatch the following Column A to Column B

View SolutionMatch the following Column A to Column B

View SolutionThe area of the shaded part in the figure given below is ______.

View SolutionThe inequation represented by the graph given below is :
View SolutionThe inequation that best describes the graph given below is _________
View SolutionThe inequation that best describes the following graph is _________
View Solution
