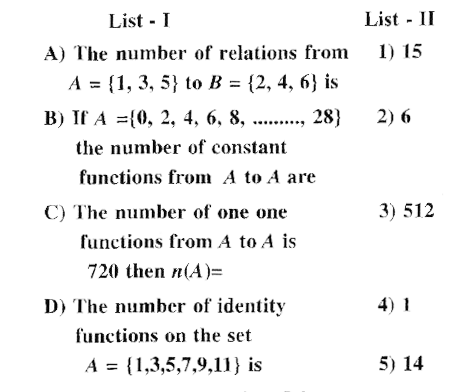
Observe the following Lists:

Then the match for List -1 from List - II is:Solution in Telugu
abcd
dbac
dacb
dbca
The correct Answer is:C
Step by step video, text & image solution for Observe the following Lists: Then the match for List -1 from List - II is: by Maths experts to help you in doubts & scoring excellent marks in Class 11 exams.
Topper's Solved these Questions
- BOOK - AAKASH SERIESCHAPTER - FUNCTIONS EXERCISE - PRACTICE EXERCISE50videos
FUNCTIONS
- BOOK - AAKASH SERIESCHAPTER - FUNCTIONS EXERCISE - EXERCISE -I53videos
FUNCTIONS
- BOOK - AAKASH SERIESCHAPTER - ERRORS AND APPROXIMATIONSEXERCISE - ADVANCED SUBJECTIVE TYPE QUESTION15videos
ERRORS AND APPROXIMATIONS
- BOOK - AAKASH SERIESCHAPTER - HEIGHTS AND DISTANCESEXERCISE - PRACTICE SHEET Exercise-I (Level-II) (Straight Objective Type Questions)13videos
HEIGHTS AND DISTANCES
Similar Questions
If f(x)=3x−75x−3 then (fof)(x)=
View SolutionIf f(x)=αx+βandf={(1,1),(2,3),(3,5),(4,7)} then the values of α,β are
06:07View SolutionFind the approximate value of log (2.01) give that log 2 = 0.6934
02:11View SolutionThe angle of elevation of the top of a tower standing on a harzontal plane from the two points lying on a line passing through the foot of the tower at distances a and b respectively are complementary angles. If the line joining the two points sutends an angle θ at the top of the tower, then sinθ is
01:31View SolutionMatch the following lists:
 02:45View Solution
Which of the following are correct chain isomers of butane ? (i)
02:17View SolutionDetermine the point of symmetry of a regular hexagon.
05:41View SolutionDtermine the images of the following figure about the given line :
02:10View SolutionMatch the following Column A to Column B
 02:17View Solution
Match the following Column A to Column B
 02:10View Solution
Match the following Column A to Column B
 02:41View Solution
The inequation represented by the graph given below is :
03:12View SolutionThe inequation that best describes the graph given below is _________
08:58View SolutionThe inequation that best describes the following graph is _________
04:00View SolutionFrom the following figure, the correct observation is :- ltimg src="https://d10lpgp6xz60nq.cloudfront.net/physics_images/ALN_PHY_R03_E08_015_Q01.png" width="80%"gt
05:46View SolutionMatch the followings (column I with column II)
ltimg src="https://d10lpgp6xz60nq.cloudfront.net/physics_images/NCERT_BIO_XI_C03_E01_011_Q01.png" width="80%"gt06:52View Solution

