Which of the following diagram correctly represent variation of pH of a solution of NH4OH by addition of increasing quantity (volume in ml) of a known HCl solution?
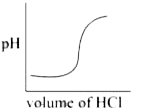
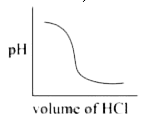
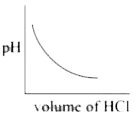
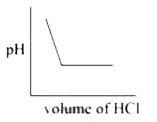
The correct Answer is:B
On adding HCl, pH of the solution will decrease slowly initially, and sharply near the equivalent point.
Similar Questions
Knowledge Check
Which of the following respresent the variation of conducatnes of solution if weak base NH4OH is titrated with dilute HCl?
A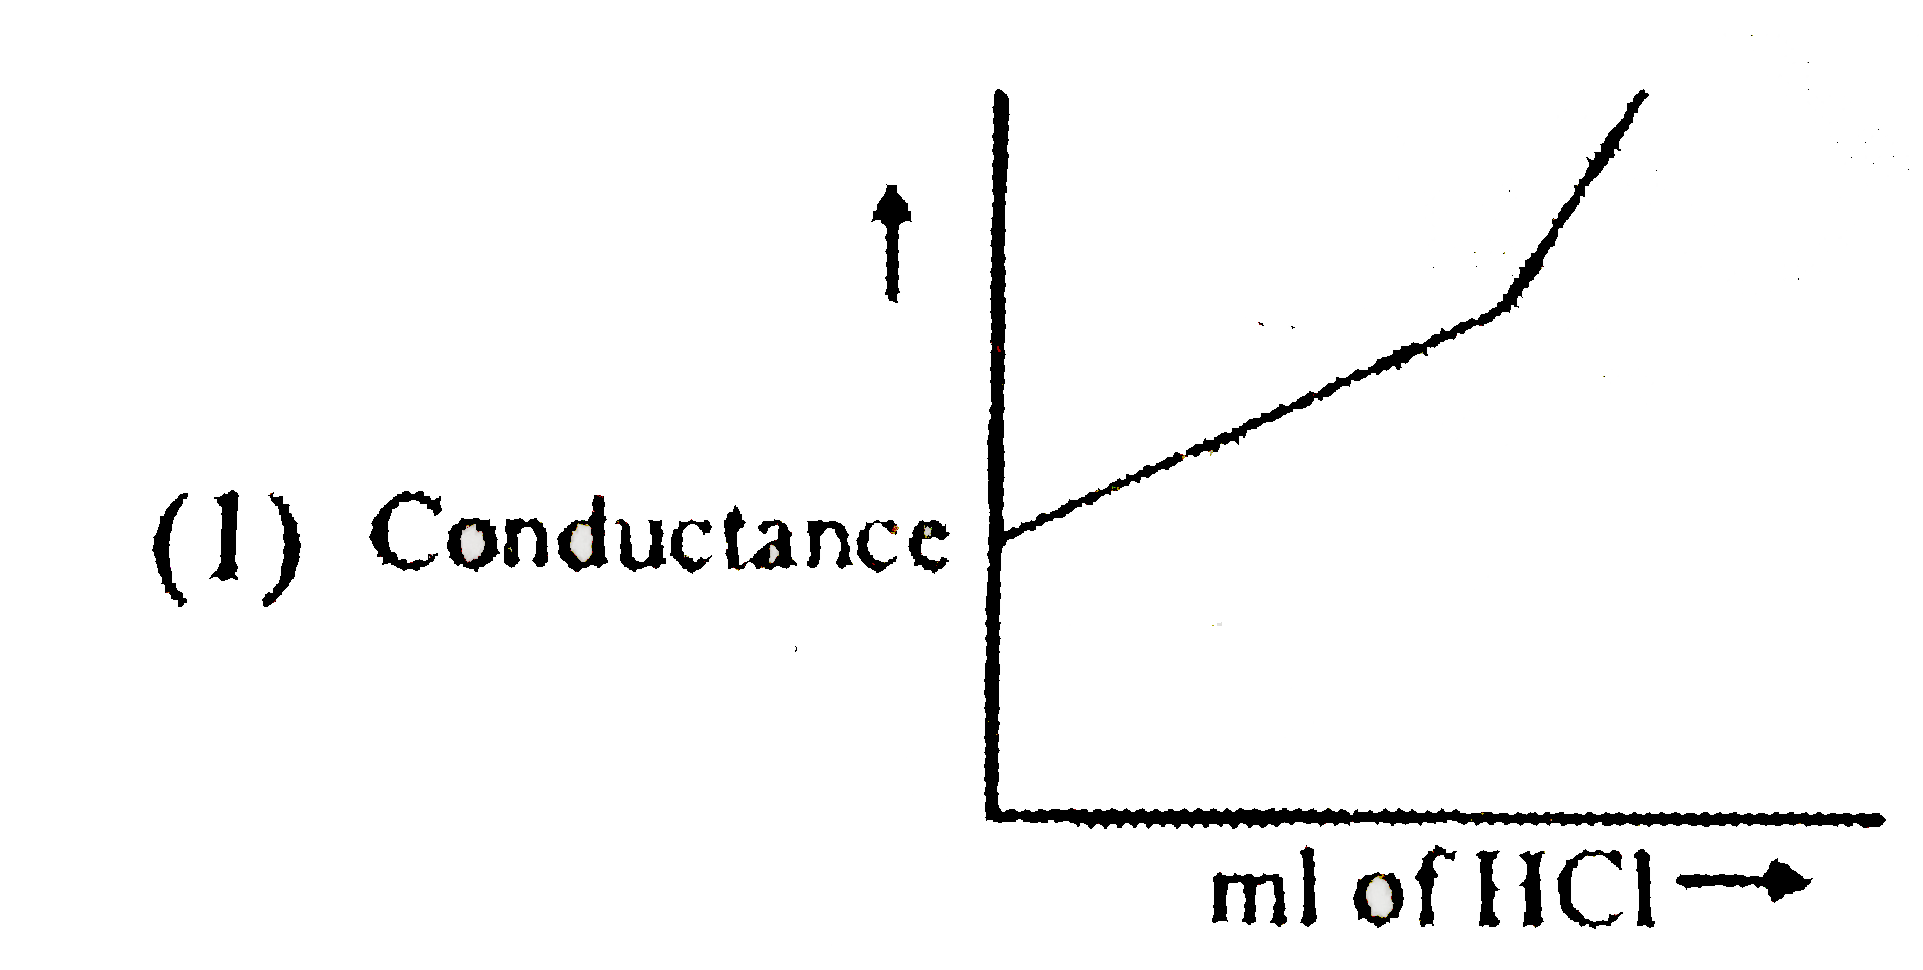 B
B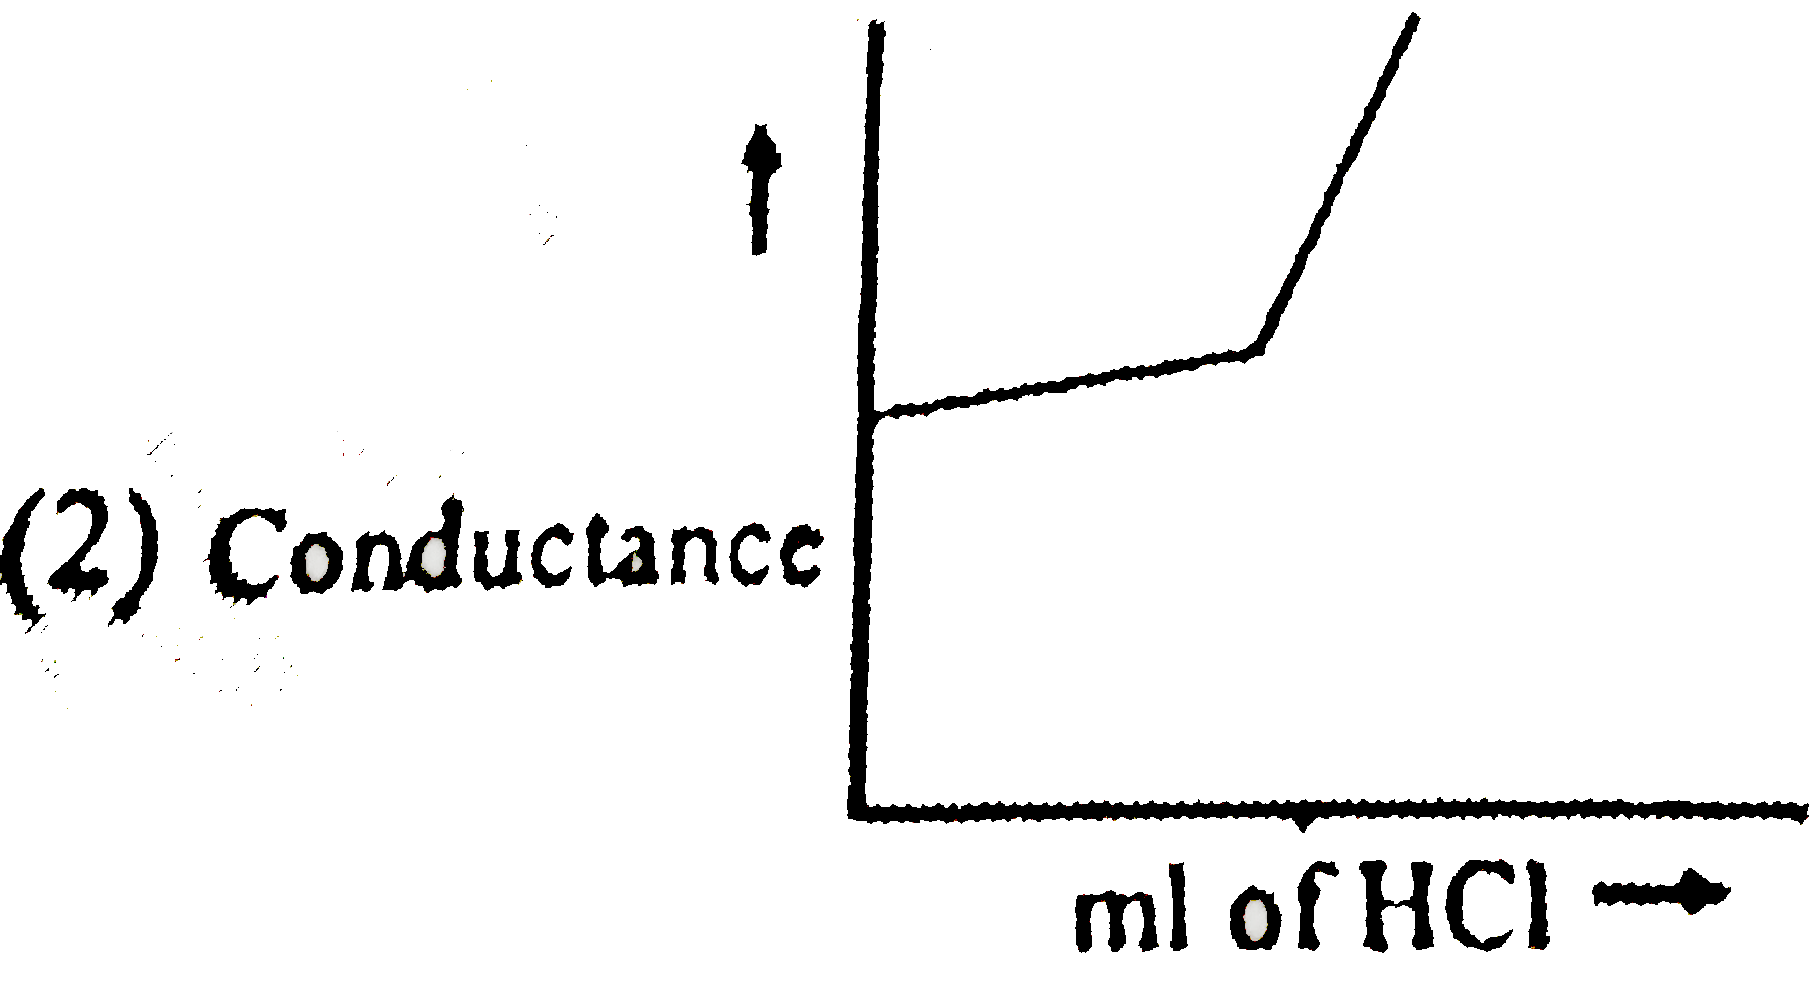 C
C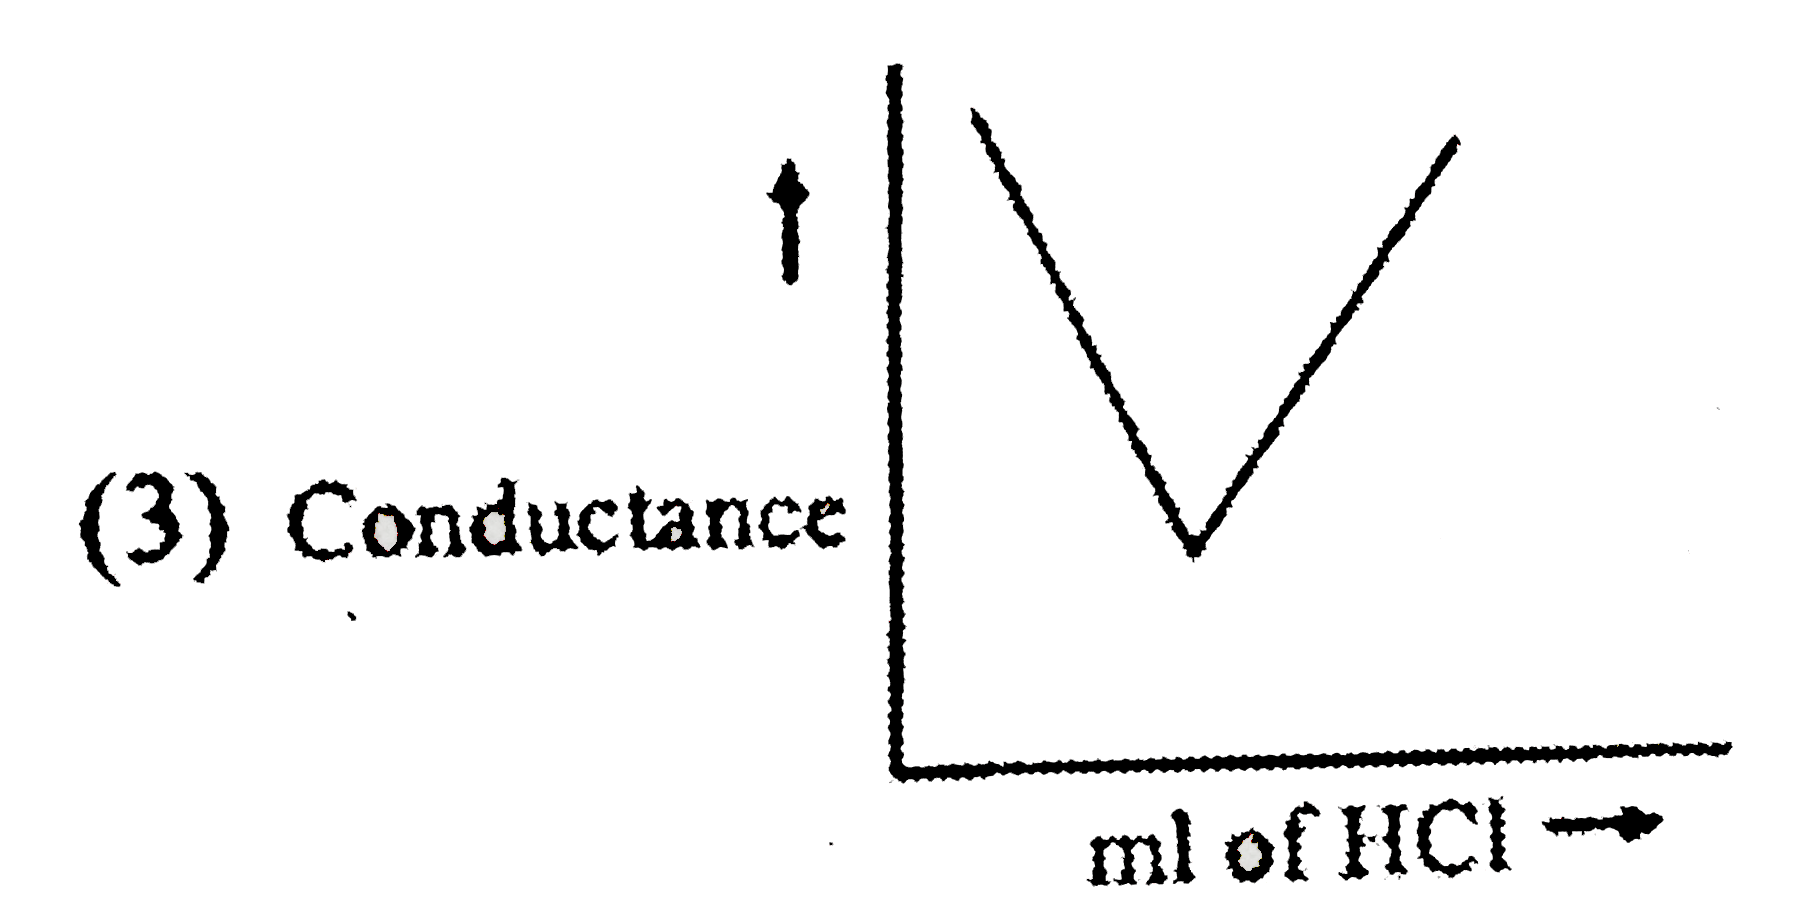 D
D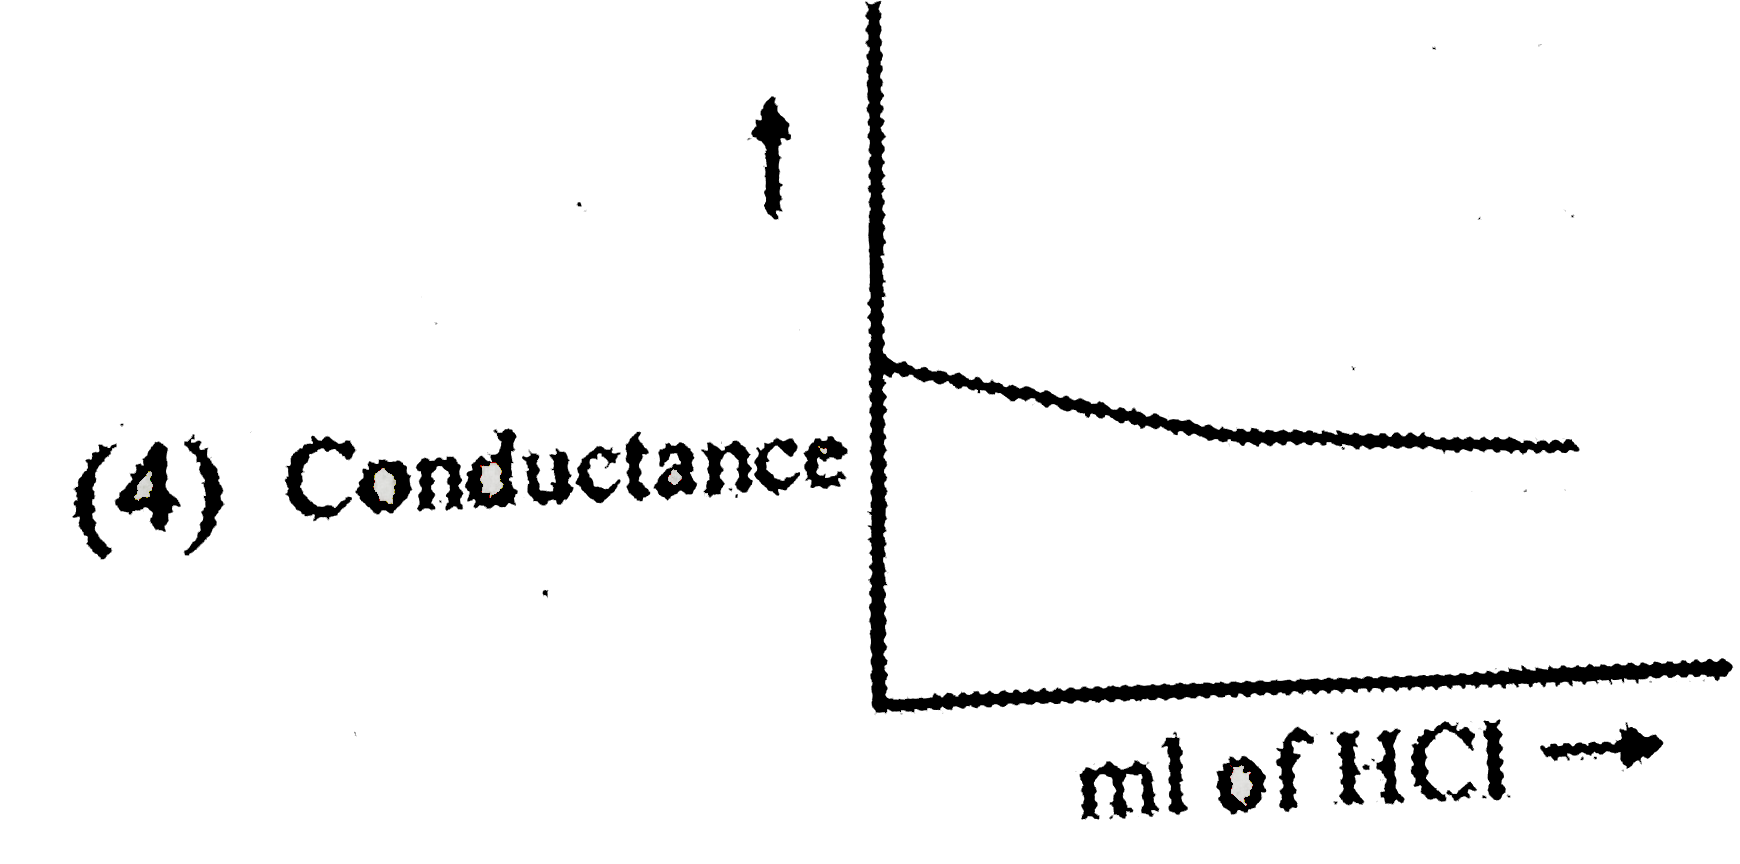
To prepare 600 mL of 2 N solution of NH4OH, volume of 10 N NH4OH required is
A60 mLB120 mLC300 mLD600 mLIf density of NH4OH solution is 1g/ml and it is 35% w/v . Calculate the normality of the solution
A1NB5NC10ND20N
The table probides the pH value of four solutions P, Q, R and s
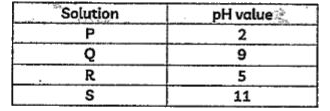
Which of the following correctly represents the solutions in increasing order of their hydronium ion concentration ?
View SolutionThe pH of a solution obtained by mixing 100mL of a solution pH of =3 with 400mL of a solution of pH =4 is
View SolutionThe pH of a solution obtained by mixing 100 mL of a solution pH=3 with 400 mL of a solution of pH=4 is
View Solution(a)When 100 ml of 0.1M NaCN solution is titrated with 0.1 M HCl solution the variation of pH of solution with volume of HCl added will be :
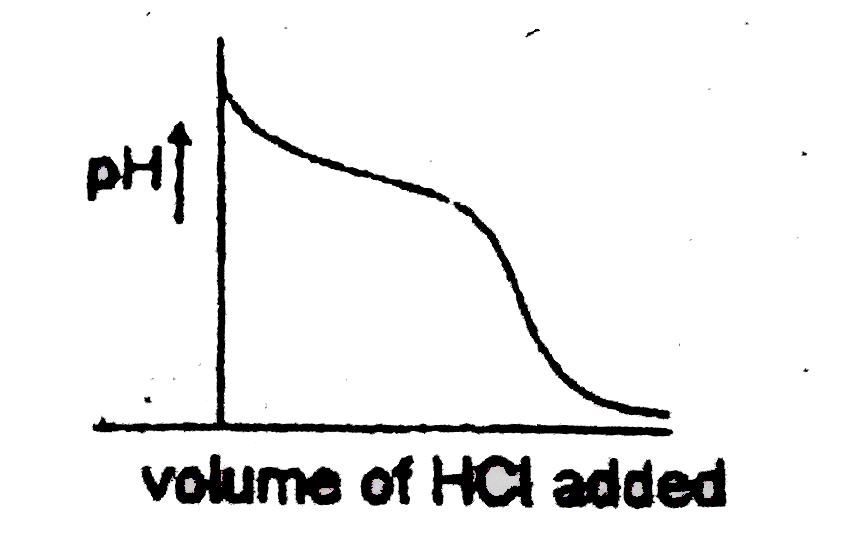
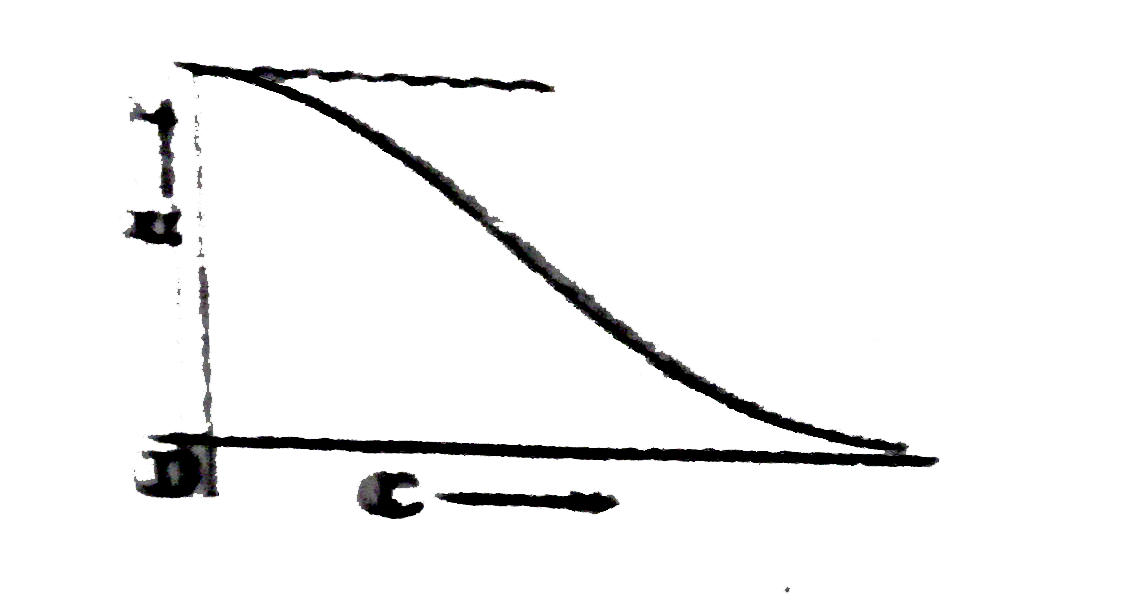
(b)Variation of degree of dissociation α with concentration for a weak electrolyte at a particular temperature is best represented by :
( c)0.1 M acetic acid solution is titrated against 0.1 M NaOH solution. The difference in pH between 1/4 and 3/4 stages of neutralization of acid will be 2 log 3.
View SolutionA solution which is resistant to change of pH upon the addition of an acid or a base is known as
View Solution
