The following table shows the ages of the students during a year are :

Find the mode.Solution in Punjabi
Step by step video & image solution for The following table shows the ages of the students during a year are : Find the mode. by Chemistry experts to help you in doubts & scoring excellent marks in Class 8 exams.
Updated on:21/07/2023Topper's Solved these Questions
Similar Questions
List conditions under which combustion can take place.
View SolutionThe following table shows the ages of the patients admitted in a hospital during a year:Find the mode and the mean of the data given above. Compare and interpret the two measures of central tendency.
View SolutionThe following table shows the marks obtained by 100 students of Class X in a school during a particular academic session.Find the mode of this distribution.
View Solution20 छात्राओ की औसत आयु 15 वर्ष है तथा 25 छात्रो की औसत आयु 24 वर्ष है, तो छात्र तथा छात्राओ की औसत आयु ज्ञात करे?
View SolutionThe following table expresses the age of eight students . Find the median age.
S. No.12345678Age (Years)18161411131092
View Solutionनिम्नलिखित सारणी किसी अस्पताल में एक विशेष वर्ष में भर्ती हुए रोगियों की आयु को दर्शाती हैं :

उपरोक्त आँकड़ों से बहुलक ज्ञात कीजिए।
View SolutionThe following frequency dsitribution table gives the ages of 80 patients treated in a hospital during a month. Find the mode of the ages of the patients.

View SolutionThe following table shows ages of people who went to a particular play of circus in a day.

Find the mode of the ages of the vistiors.
View SolutionThe following table shows the ages of the patients admitted in a hospital during a year :
Age (in years)Number of patients5−15615−251125−352135−452345−551455−655
Find the mode and the mean of the data given above . Copmare and interpret the two measures of central tendency .
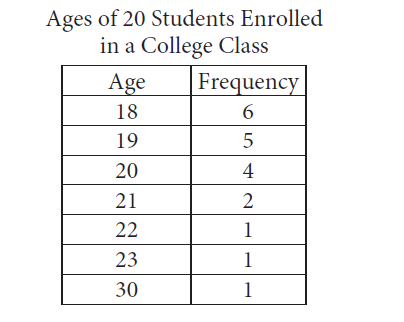
View SolutionAges of 20 Students Enrolled in a College Class

The table above shows the distribution of ages of the 20 students enrolled in a college class. Which of the following gives the correct order of the mean, median, and mode of the ages?
View SolutionThe following table shows the ages of the patients admitted in a hospital during a year:

Find the mode and the mean of the data given above. Compare and interpret the two measures of central tendency.
View SolutionThe ages (in years) of 11 cricket players are given below
28,34,32,41,36,32,32,38,32,40,31
Find the mode of the age
View SolutionThe following table shows the ages of the patients admitted in a hospital during a year:Find the mode and the mean of the data given above. Compare and interpret the two measures of central tendency.
View SolutionThe following table shows the ages of the students during a year are :

Find the mode.
View SolutionThe following table shows ages of people who went to a particular
play of circus in a day.

Find the mode of the ages of the vistiors.
View Solutionअपनी कक्षा के साथियों की आयु वर्षों के रिकॉर्ड कीजिए और फिर उनका बहुलक ज्ञात कीजिए।
View Solution
