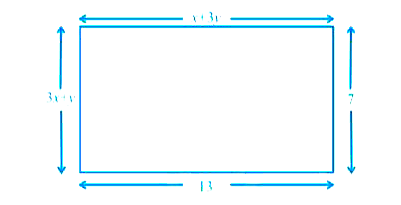
निम्नलिखित आयत में x और y के मान ज्ञात कीजिए:

Step by step video & image solution for निम्नलिखित आयत में x और y के मान ज्ञात कीजिए: by Maths experts to help you in doubts & scoring excellent marks in Class 10 exams.
Updated on:21/07/2023Topper's Solved these Questions
- दो चरों वाले रैखिक समीकरणों के युग्म BOOK - NCERT EXEMPLAR HINDICHAPTER - दो चरों वाले रैखिक समीकरणों के युग्म EXERCISE - प्रश्नावली 3.4
12 Videos
- दो चरों वाले रैखिक समीकरणों के युग्म BOOK - NCERT EXEMPLAR HINDICHAPTER - दो चरों वाले रैखिक समीकरणों के युग्म EXERCISE - प्रश्नावली 3.2
12 Videos
- त्रिभुज BOOK - NCERT EXEMPLAR HINDICHAPTER - त्रिभुज EXERCISE - प्रश्नावली 6.4
18 Videos
- द्विघात समीकरण BOOK - NCERT EXEMPLAR HINDICHAPTER - द्विघात समीकरण EXERCISE - प्रश्नावली 4.4
12 Videos
Similar Questions
निम्नलिखित समीकरण-युग्म को आलेखीय रूप से हल कीजिए :
2x+y=6
2x−y+2=0
उन दो त्रिभुजों के क्षेत्रफलों का अनुपात ज्ञात कीजिए, जो इन समीकरणों को निरूपित करने वाली रेखाओं द्वारा क्रमश: x-अक्ष और y-अक्ष द्वारा बनाए जाते हैं।
View Solutionक्या समीकरणों के निम्नलिखित युग्म का कोई हल नहीं है? अपने उत्तर का औचित्य दीजिए।
2x+4y=3
12y+6x=6
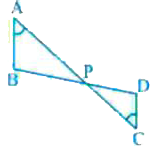
View Solutionआकृति 6.16 में, यदि ∠A=∠C,AB=6cm,AP=12cm,BP=15cm, और CP = 4 cm है, तो PD और CD की लंबाइयाँ ज्ञात कीजिए।

View Solutionज्ञात कीजिये कि क्या निम्नलिखित समीकरणों के वास्तविक मूल है । यदि वास्तविक मूल है, तो उन्हें ज्ञात कीजिये।
8x2+2x−3=0
View SolutionHow many lines of symmetry does the above figure have ?
View SolutionWhich of the following are correct chain isomers of butane ? (i)
View SolutionDetermine the point of symmetry of a regular hexagon.
View SolutionDtermine the images of the following figure about the given line :
View SolutionMatch the following Column A to Column B

View SolutionMatch the following Column A to Column B

View SolutionMatch the following Column A to Column B

View SolutionFind the area of the figure given below.

View SolutionThe inequation represented by the graph given below is :
View SolutionThe inequation that best describes the graph given below is _________
View SolutionThe inequation that best describes the following graph is _________
View SolutionWhich inequations represent the shaded region in the given figure
View Solution
