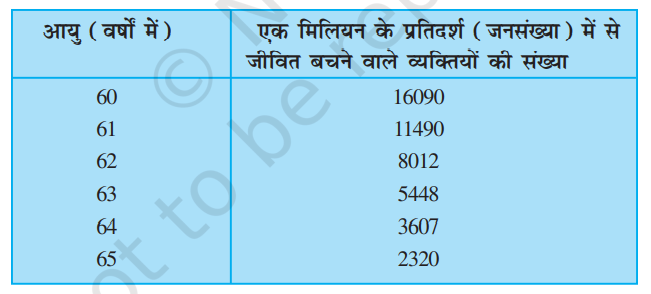
यहाँ एक जन्म-मृत्यु दर सारणी का एक अंश दिया गया है:

इसकी प्रायिकता क्या है कि 61 वर्ष की आयु वाला व्यक्ति 4 वर्ष तक जीवित रहेगा?
The correct Answer is:2321149
Step by step video & image solution for यहाँ एक जन्म-मृत्यु दर सारणी का एक अंश दिया गया है: इसकी प्रायिकता क्या है कि 61 वर्ष की आयु वाला व्यक्ति 4 वर्ष तक जीवित रहेगा? by Maths experts to help you in doubts & scoring excellent marks in Class 9 exams.
Updated on:21/07/2023Topper's Solved these Questions
- सांख्यिकी और प्रायिकताBOOK - NCERT EXEMPLAR HINDICHAPTER - सांख्यिकी और प्रायिकताEXERCISE - प्रश्नावली (14.1)
30 Videos
- सांख्यिकी और प्रायिकताBOOK - NCERT EXEMPLAR HINDICHAPTER - सांख्यिकी और प्रायिकताEXERCISE - प्रश्नावली (14.2)
10 Videos
- समांतर चतुर्भुजों और त्रिभुजों के क्षेत्रफल BOOK - NCERT EXEMPLAR HINDICHAPTER - समांतर चतुर्भुजों और त्रिभुजों के क्षेत्रफल EXERCISE - प्रश्नावली 9.4
10 Videos
- हीरोन का सूत्र BOOK - NCERT EXEMPLAR HINDICHAPTER - हीरोन का सूत्र EXERCISE - प्रश्नावली 12.4
8 Videos
Similar Questions
वर्ग 90-120 का वर्ग चिह्न है :
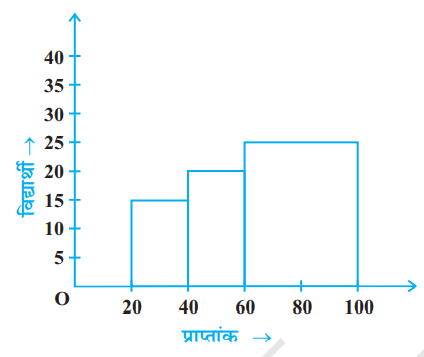
View Solutionबारंबारता सारणी

को आलेखीय रूप से नीचे दर्शाए अनुसार निरूपित किया गया है:

क्या आप सोचते हैं कि यह निरूपण सही है? क्यों?
View Solutionकिसी समांतर चतुर्भुज ABCD की भुजा BC पर कोई बिंदु E लिया जाता है। AE और DC को बढ़ाया जाता है जिससे वे F पर मिलती है। सिद्ध कीजिए कि ar (ADF)=ar(ABFC) है।
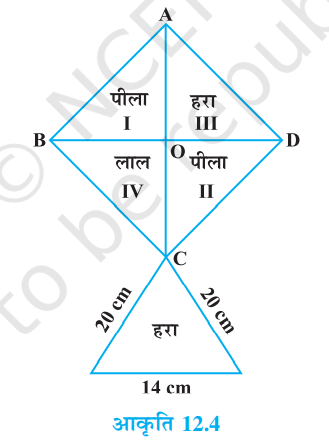
View Solutionआकृति में दी हुई पतंग को बनाने के लिए प्रत्येक शेड (रंग) के कितने कागज की आवश्यकता होगी, यदि ABCD विकर्ण 44 cm वाला एक वर्ग है।

View SolutionHow many lines of symmetry does the above figure have ?
View SolutionWhich of the following are correct chain isomers of butane ? (i)
View SolutionDetermine the point of symmetry of a regular hexagon.
View SolutionDtermine the images of the following figure about the given line :
View SolutionMatch the following Column A to Column B

View SolutionMatch the following Column A to Column B

View SolutionMatch the following Column A to Column B

View SolutionFind the area of the figure given below.

View SolutionThe area of the shaded part in the figure given below is ______.

View SolutionThe inequation represented by the graph given below is :
View SolutionThe inequation that best describes the graph given below is _________
View SolutionThe inequation that best describes the following graph is _________
View Solution
