Which of the diagrams correctly shows the change in kinetic energy of an iron sphere falling freely in a lake having sufficient depth to impart it a terminal velocity ?
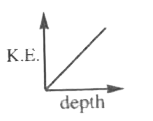
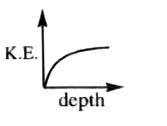
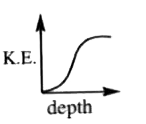
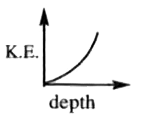
The correct Answer is:B
Similar Questions
Knowledge Check
Which of the diagrams corectly shows the change in kinetic energy of an iron sphere falling freely in a lake having sufficient depth to impart it a terminal velocity ?
A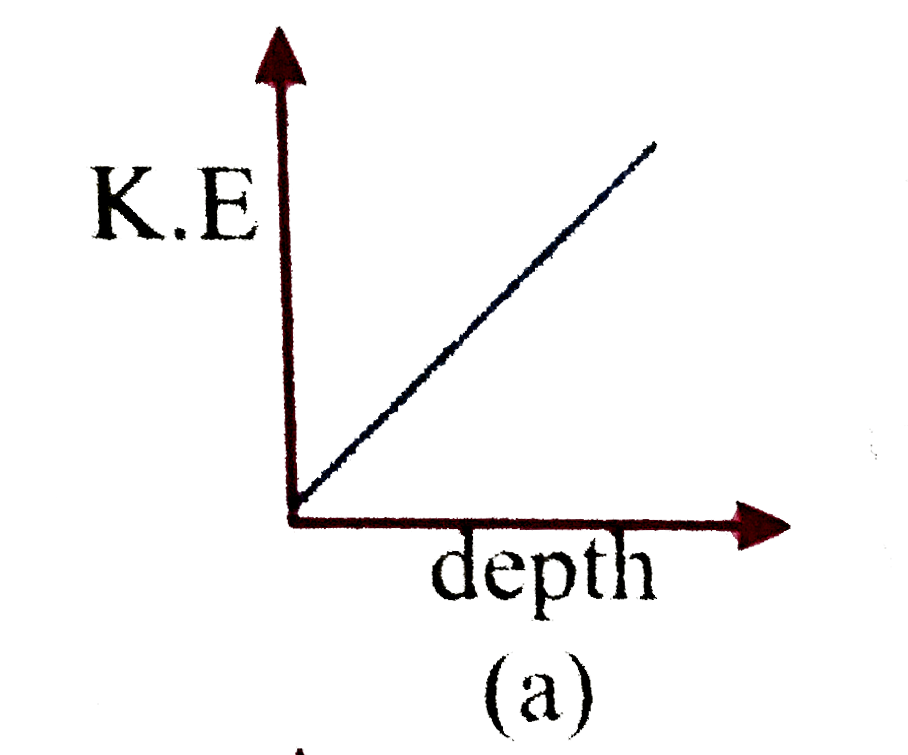 .B
.B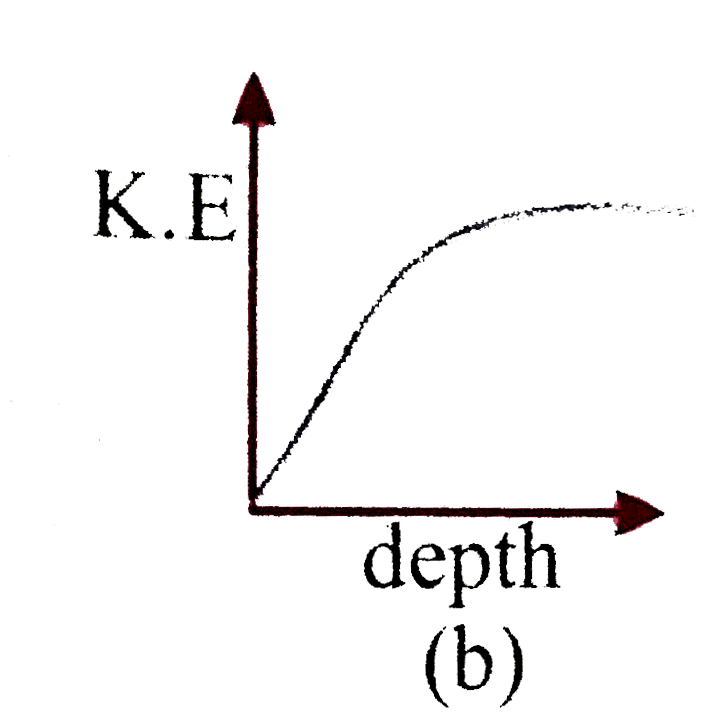 .C
.C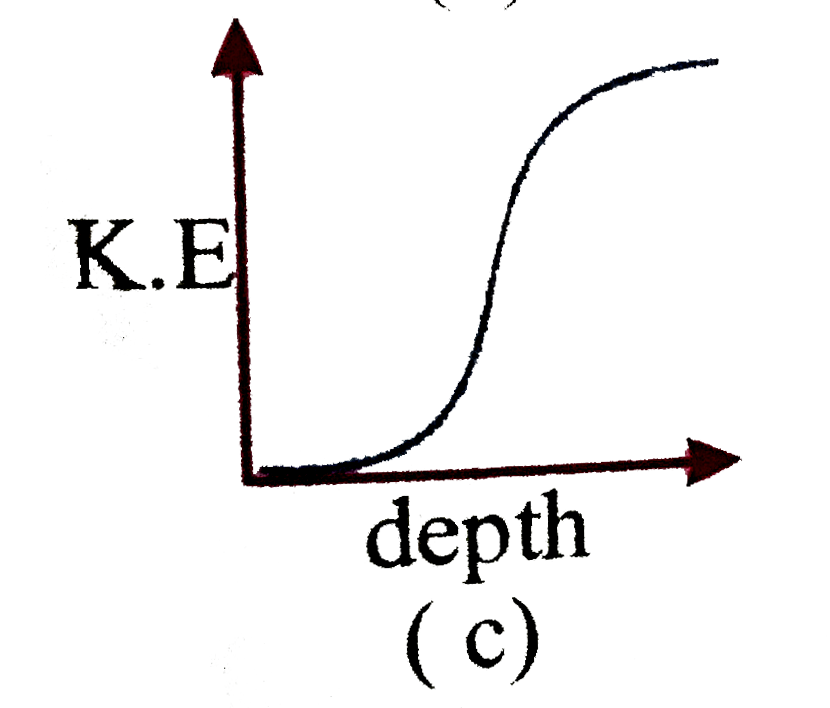 .D
.D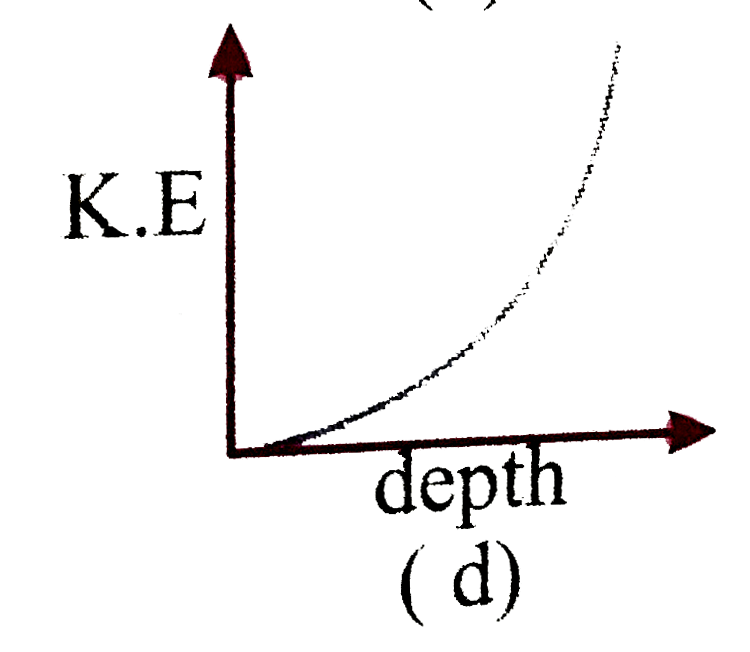 .
.Which of the diagrams in figure, correctly shows the change in kinetic energy of an iron sphere falling freely in a lake having sufficient depth to impart if a terminal velocity ?
A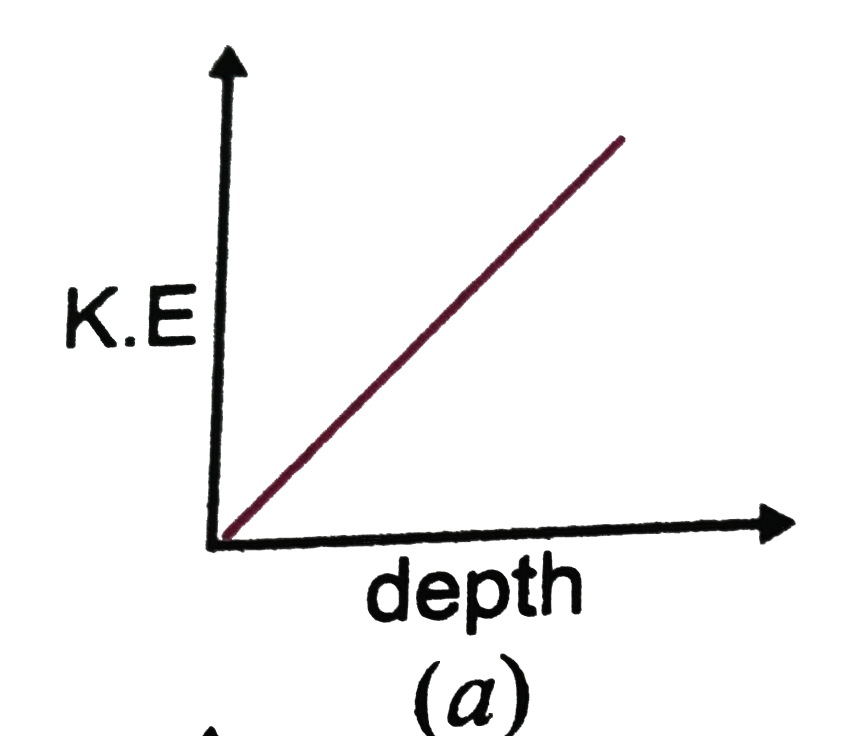 B
B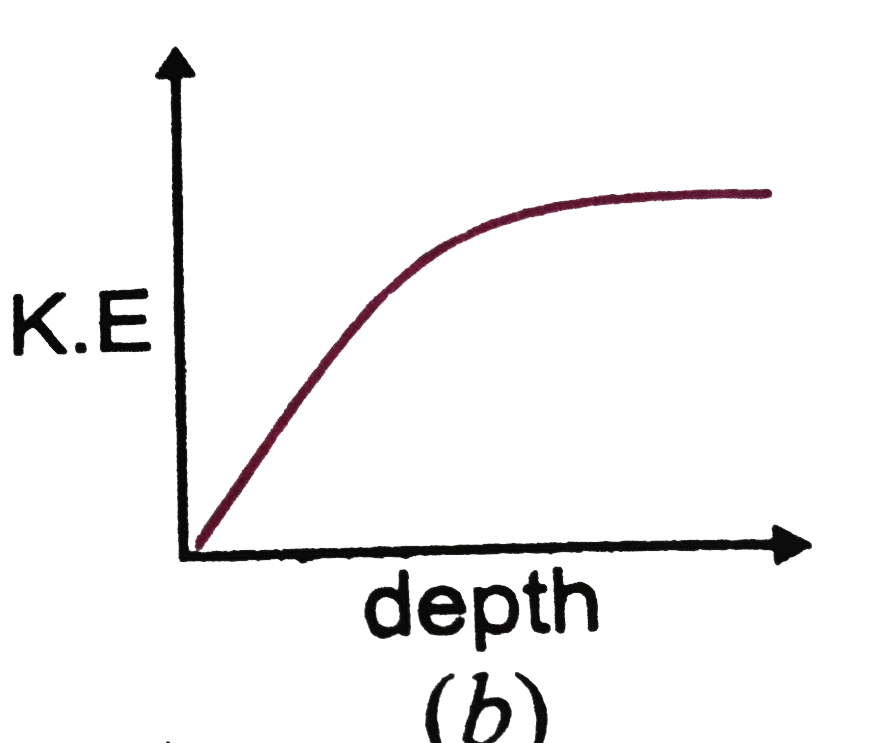 C
C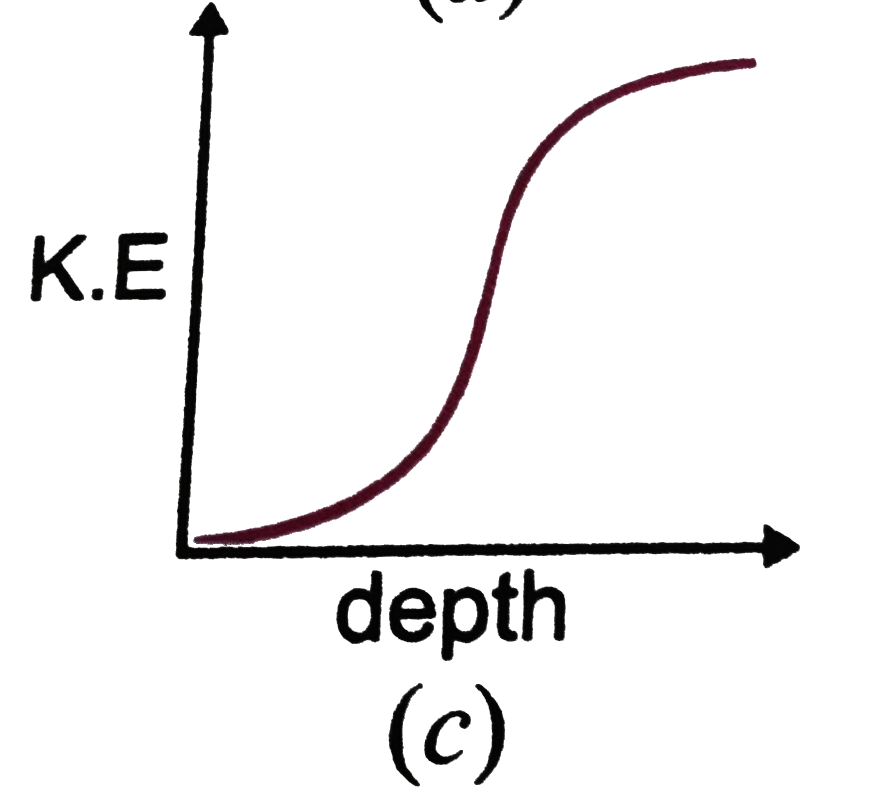 D
D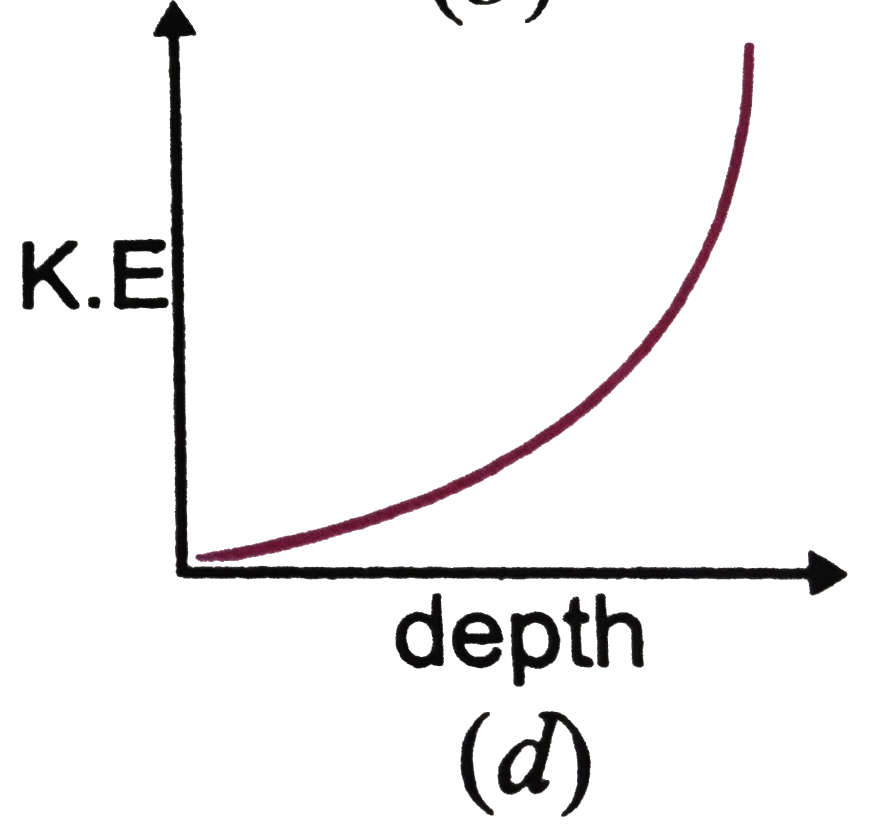
Which of the diagrams in figure, correctly shows the change in kinetic energy of an iron sphere falling freely in a lake having sufficient depth to impart if a terminal velocity ?
A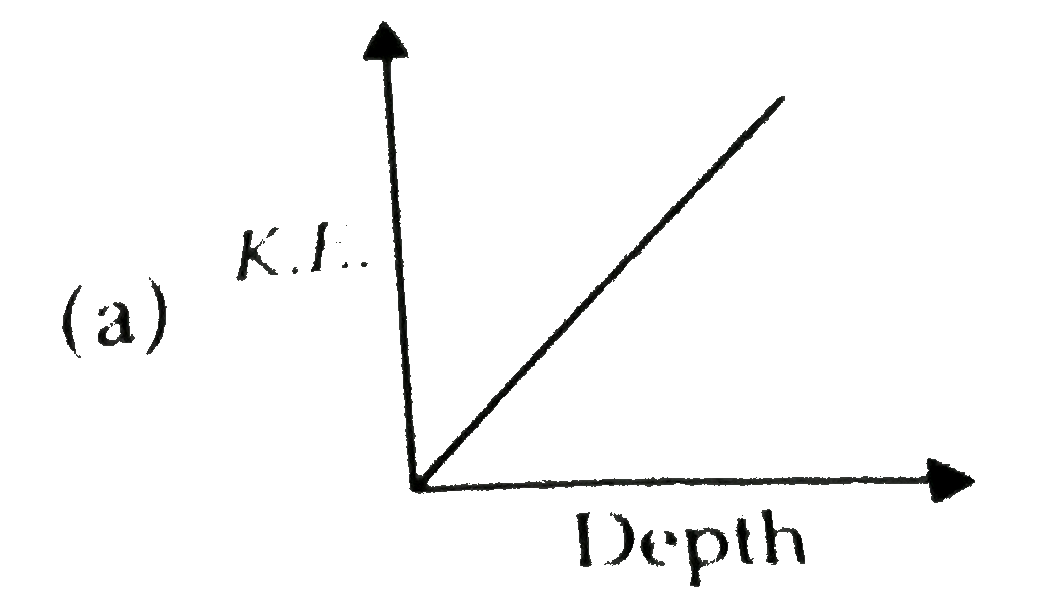 B
B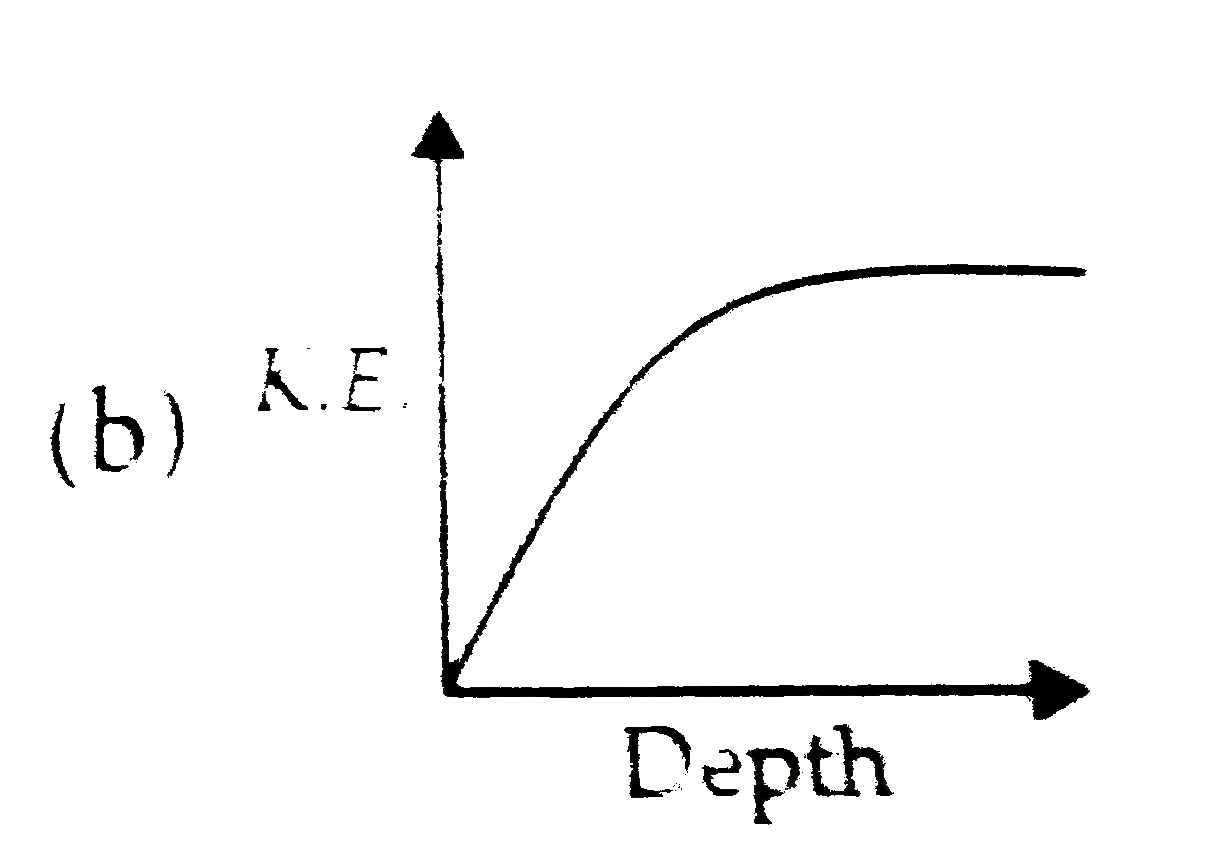 C
C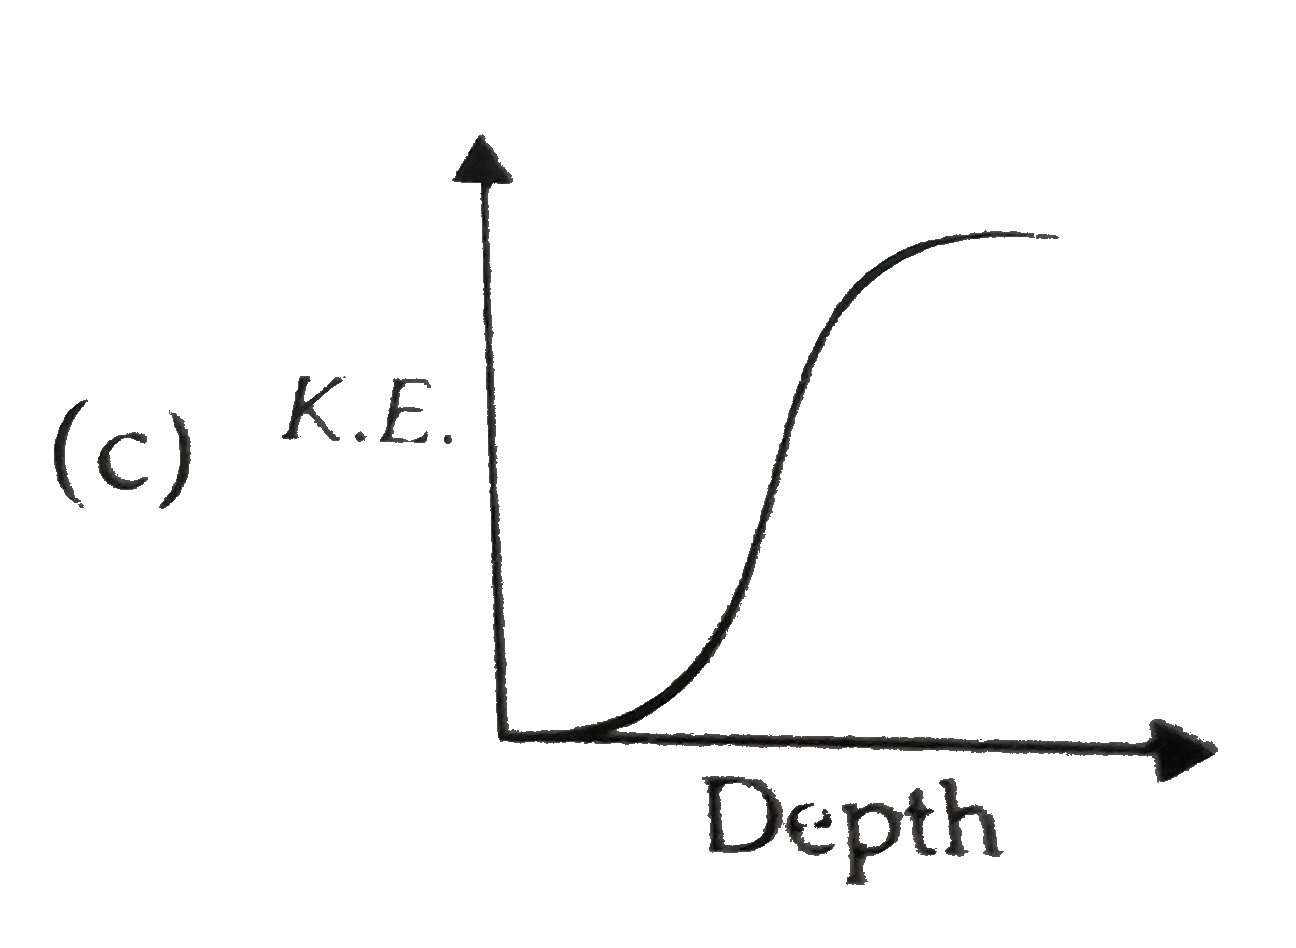 D
D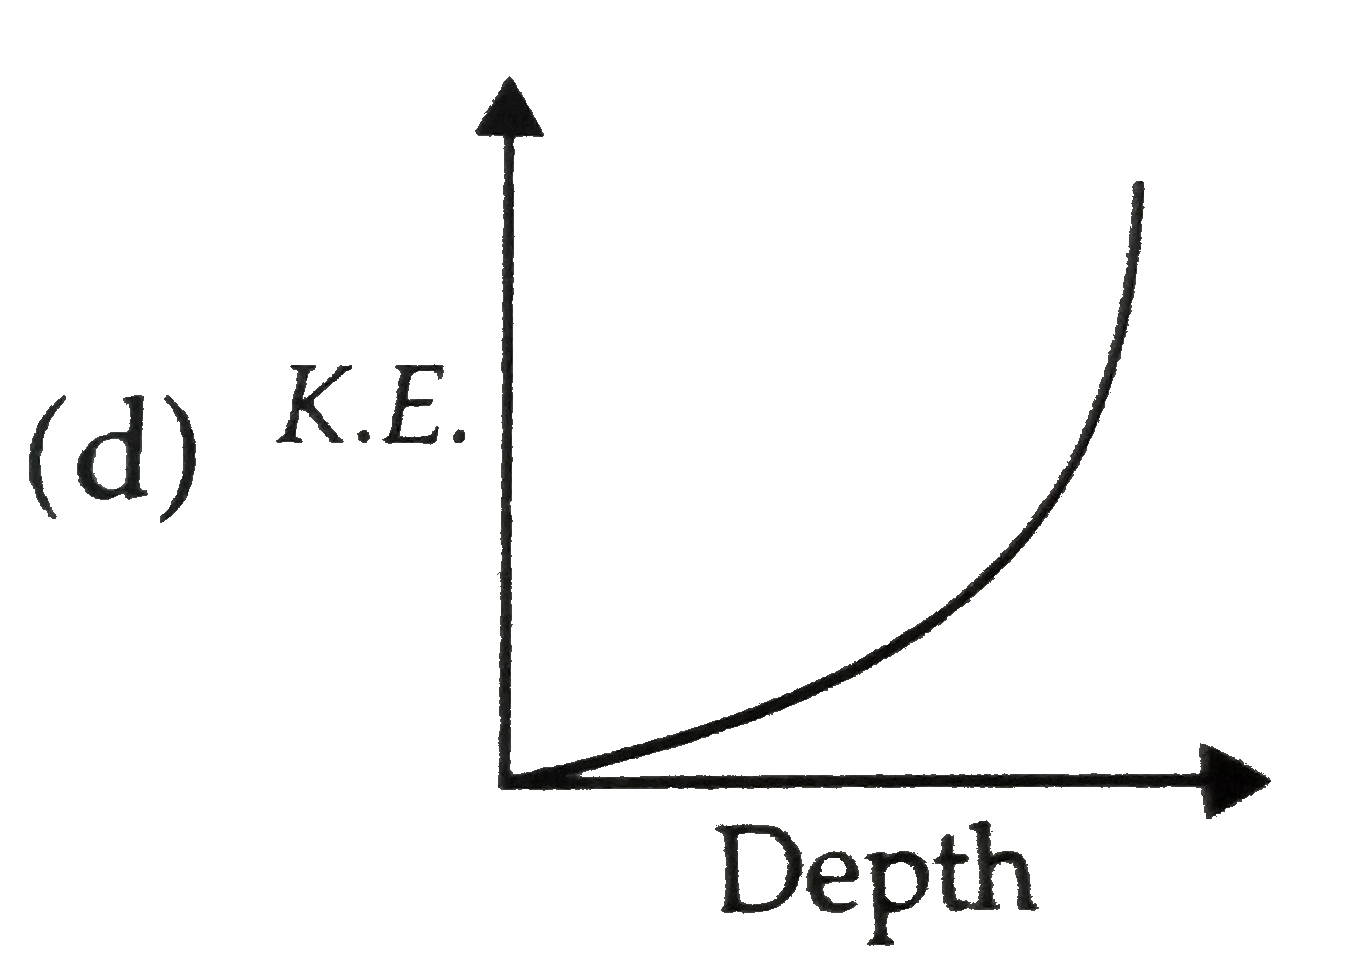
Which of the following graph correctly represents velocity-time relationship for a particle released from rest to fall freely under gravity ?
View SolutionA raindrop falling from a height h above ground, attains a near terminal velocity when it has fallen through a height (3/4)h. Which of the diagrams shown in figure correctly shows the change in kinetic and potential energy of the drop during its fall up to the ground ?
View SolutionA raindrop falling from a height h above ground, attains a near terminal velocity when it has fallen through a height (3/4)h. Which of the diagrams shown in figure correctly shows the change in kinetic and potential energy of the drop during its fall up to the ground ?
View SolutionA raindrop falling from a height h above ground, attains a near terminal velocity when it has fallen through a height (3/4)h. Which of the diagrams shown in figure correctly shows the change in kinetic and potential energy of the drop during its fall up to the ground ?
View SolutionWhich of the following graph correctly represents velocity-time relationship for a particle released from rest to fall freely under gravity ?
View Solution
