A particle moves in a straight line obeying the v-t graph as shown in the figure. The average velocity of the particle over the time T is :
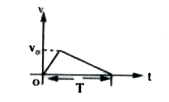
zero
v02
2v03
3v04
The correct Answer is:D
Topper's Solved these Questions
- KINEMATICSBOOK - AAKASH SERIESCHAPTER - KINEMATICSEXERCISE - LECTURE SHEET (EXERCISE-III) ( Graphs) ( More than One Correct answer Type Questions)
1 Videos
- KINEMATICSBOOK - AAKASH SERIESCHAPTER - KINEMATICSEXERCISE - LECTURE SHEET (EXERCISE-III) ( Graphs) (Linked Comprehension Type Questions)
3 Videos
- KINEMATICSBOOK - AAKASH SERIESCHAPTER - KINEMATICSEXERCISE - LECTURE SHEET (EXERCISE - II) (Vertical Motion)( Integer Type Questions)
1 Videos
- HORIZONTAL CIRCULAR MOTIONBOOK - AAKASH SERIESCHAPTER - HORIZONTAL CIRCULAR MOTIONEXERCISE - ADDITIONAL PRACTICE EXERCISE (PRACTICE SHEET (ADVANCED) Integer Type Questions)
3 Videos
- KINETIC THEORY OF GASESBOOK - AAKASH SERIESCHAPTER - KINETIC THEORY OF GASESEXERCISE - Practice Exercise
15 Videos
Similar Questions
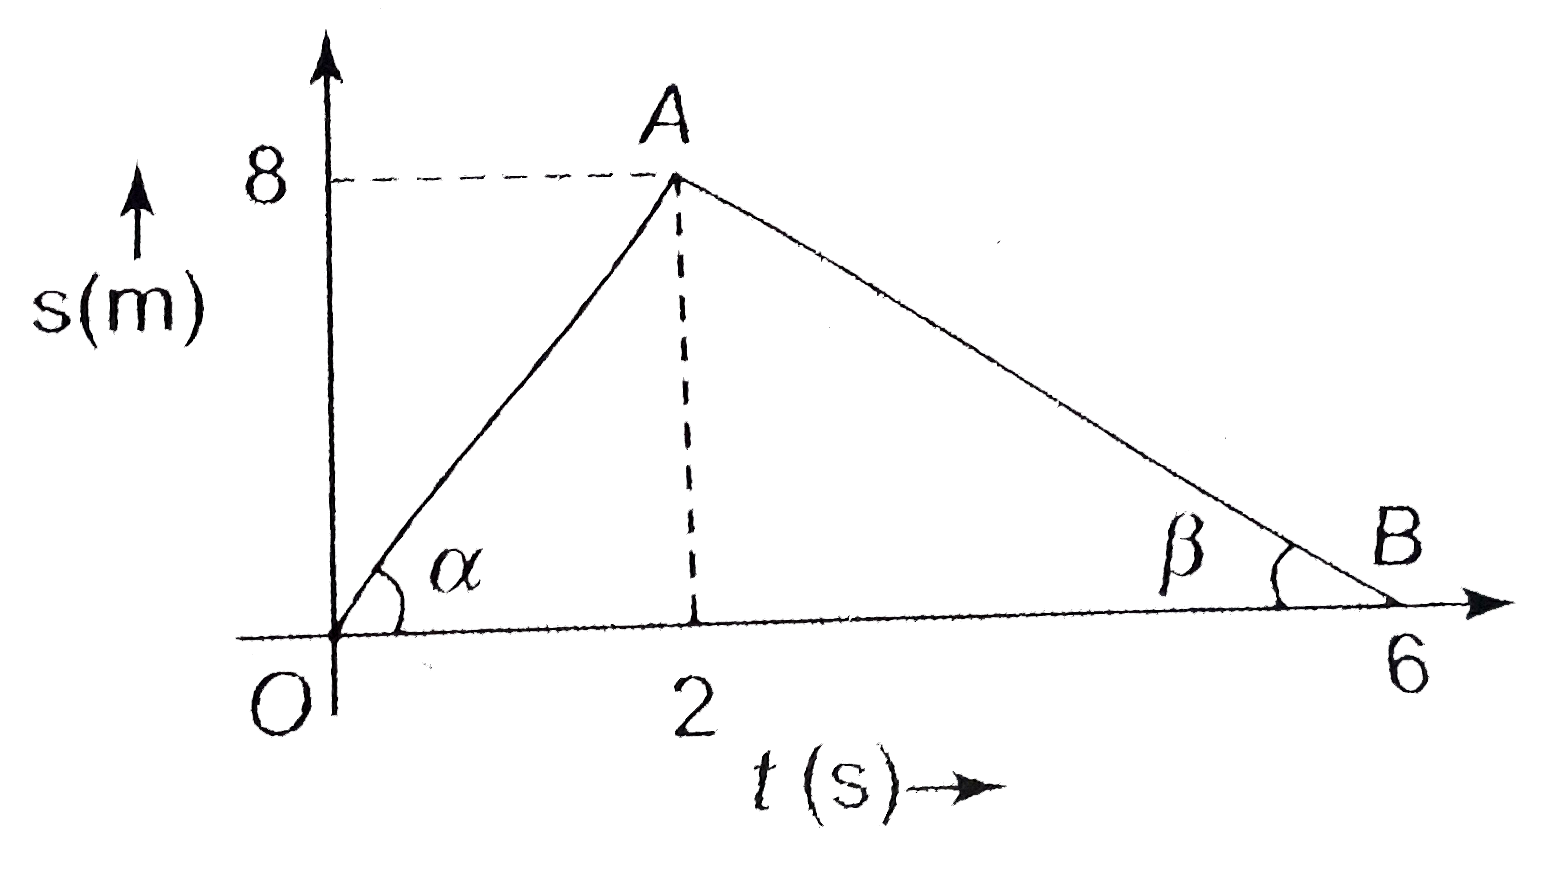
For a particle moving in a straight line, the position-time graph is as shown in the figure. Find the velocity of the particle at time t=1s and t=4s. Also sketch the v-t graph.
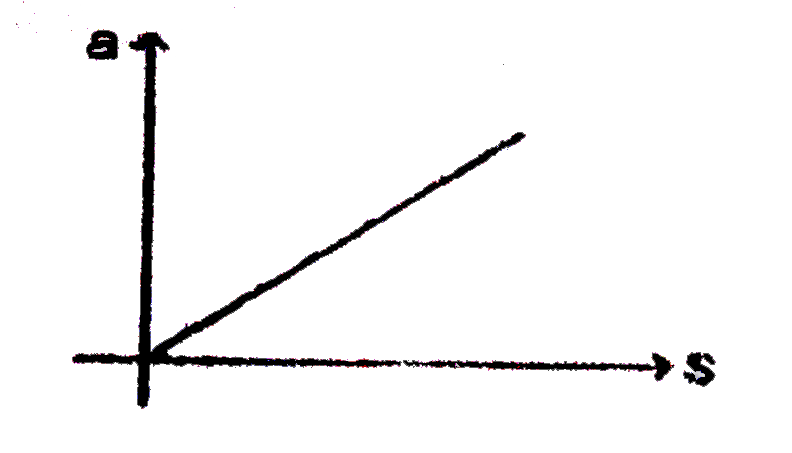
View SolutionAcceleration (a) -displacement (s) graph of a particle moving in a straight line is as shown in the figure. The initial velocity of the particle is zero. The v−s graph of the particle would be
View Solution
Knowledge Check
Acceleration (a) -displacement (s) graph of a particle moving in a straight line is as shown in the figure. The initial velocity of the particle is zero. The v−s graph of the particle would be
 A
A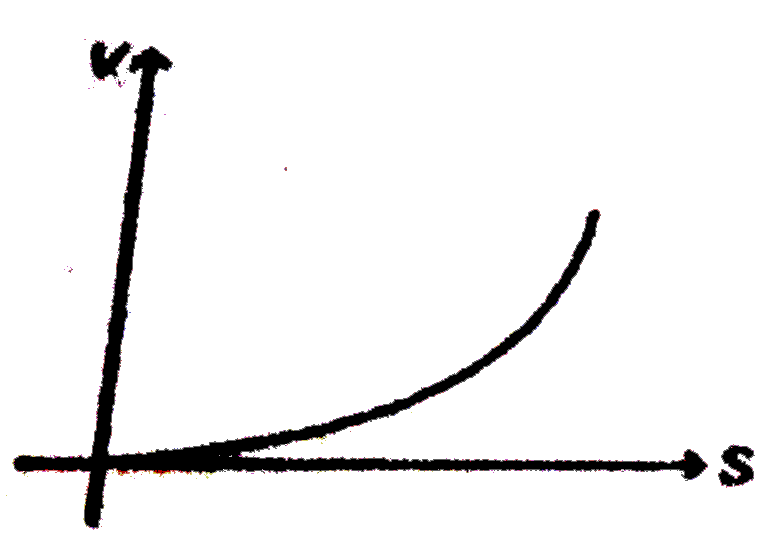 B
B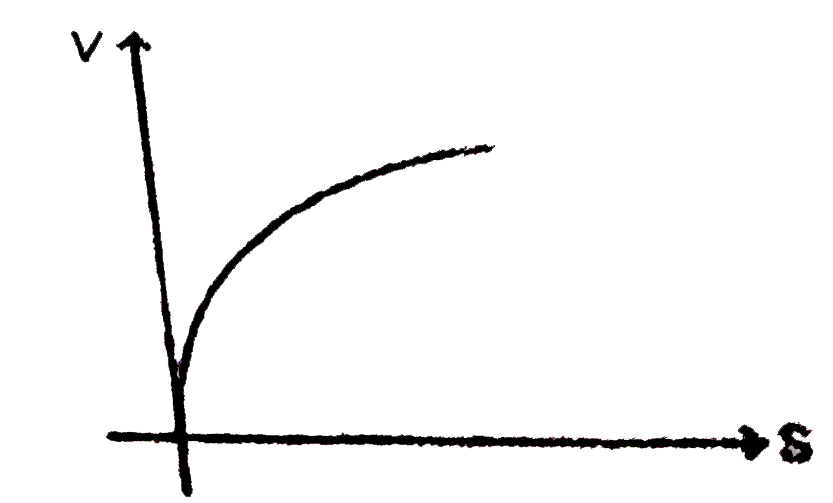 C
C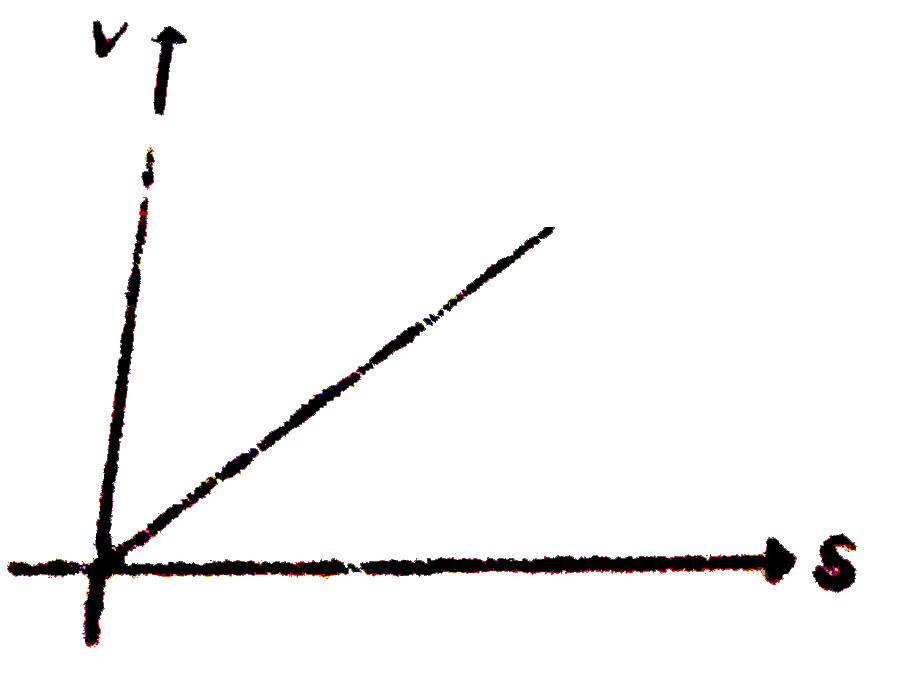 D
D
The acceleration-time graph of a particle moving in a straight line is as shown in figure. The velocity of the particle at time t=0 is 2m/s. The velocity after 2 seconds will be
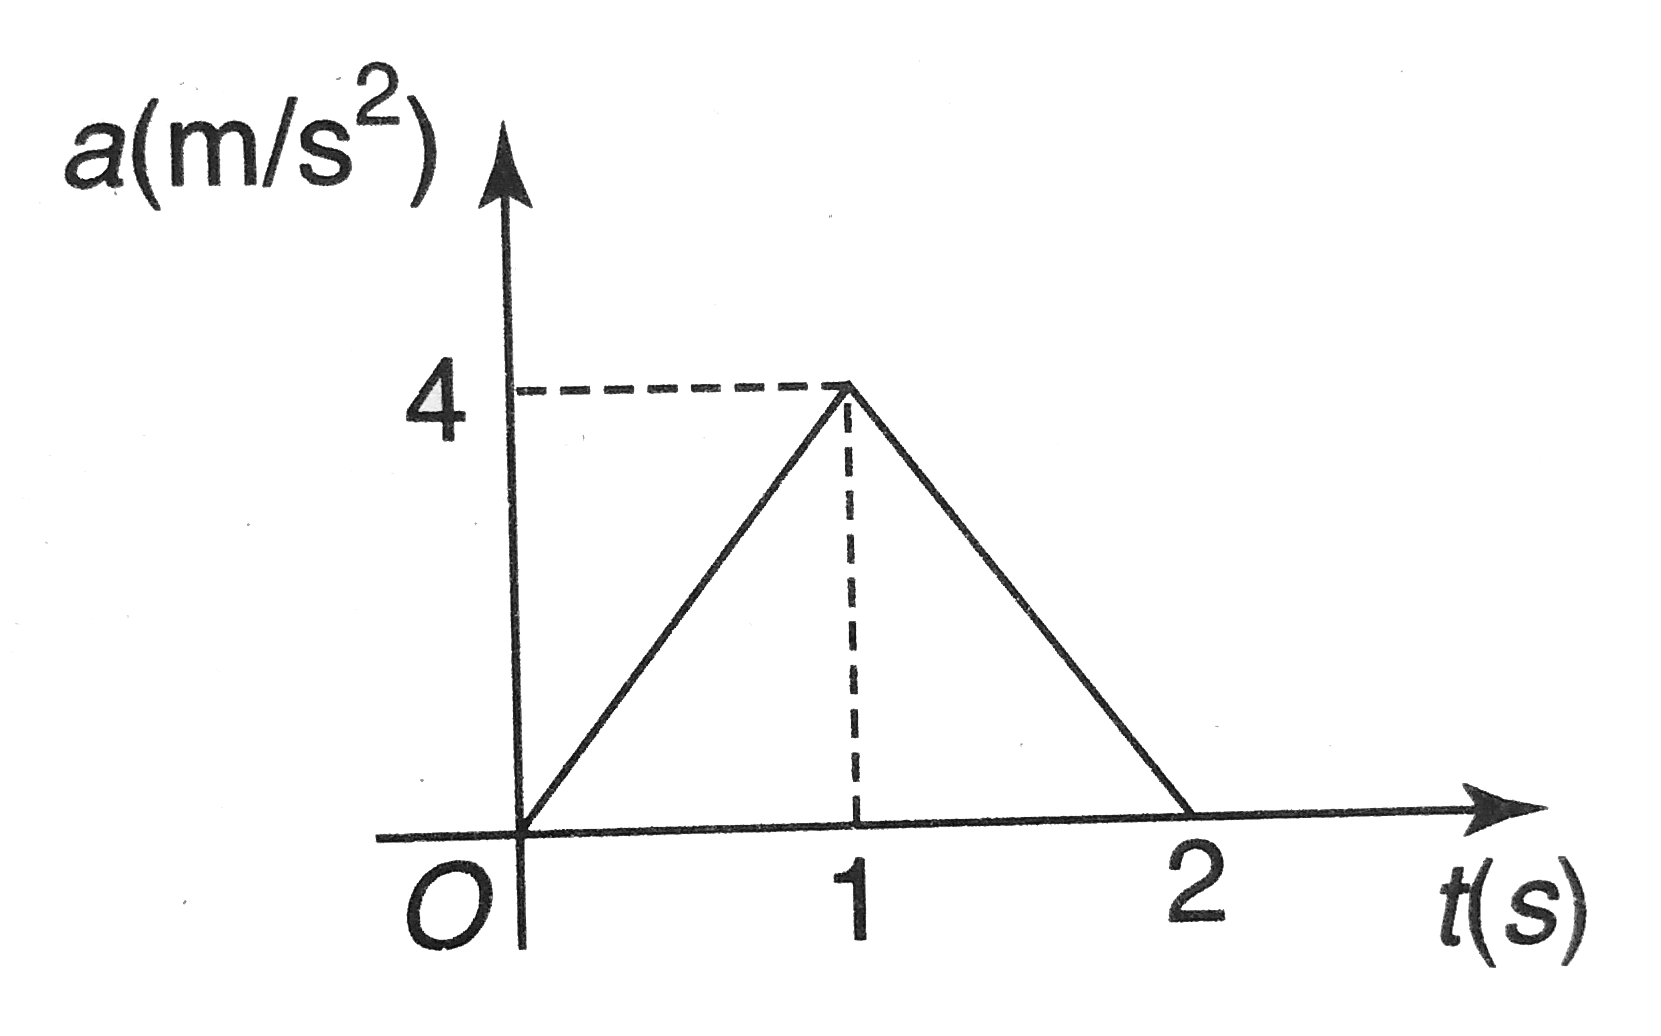 A6m/sB4m/sC2m/sD8m/s
The displacement-time graph for a particle moving in a straight line is as shown in the figure. Determine the velocity of the particle at t=1s,3s and 6s. Sketch the velocity-time graph.
View SolutionThe acceleration-time graph of a particle moving in a straight line is as shown in figure. The velocity of the particle at time t=0 is 2m/s. The velocity after 2 seconds will be

View SolutionThe acceleration-time graph of a particle moving in a straight line is as shown in figure. The velocity of the particle at time t=0 is 2m/s. The velocity after 2 seconds will be

View SolutionA particle obeys the following v - t graph as shown. The average velocity over 30 s is
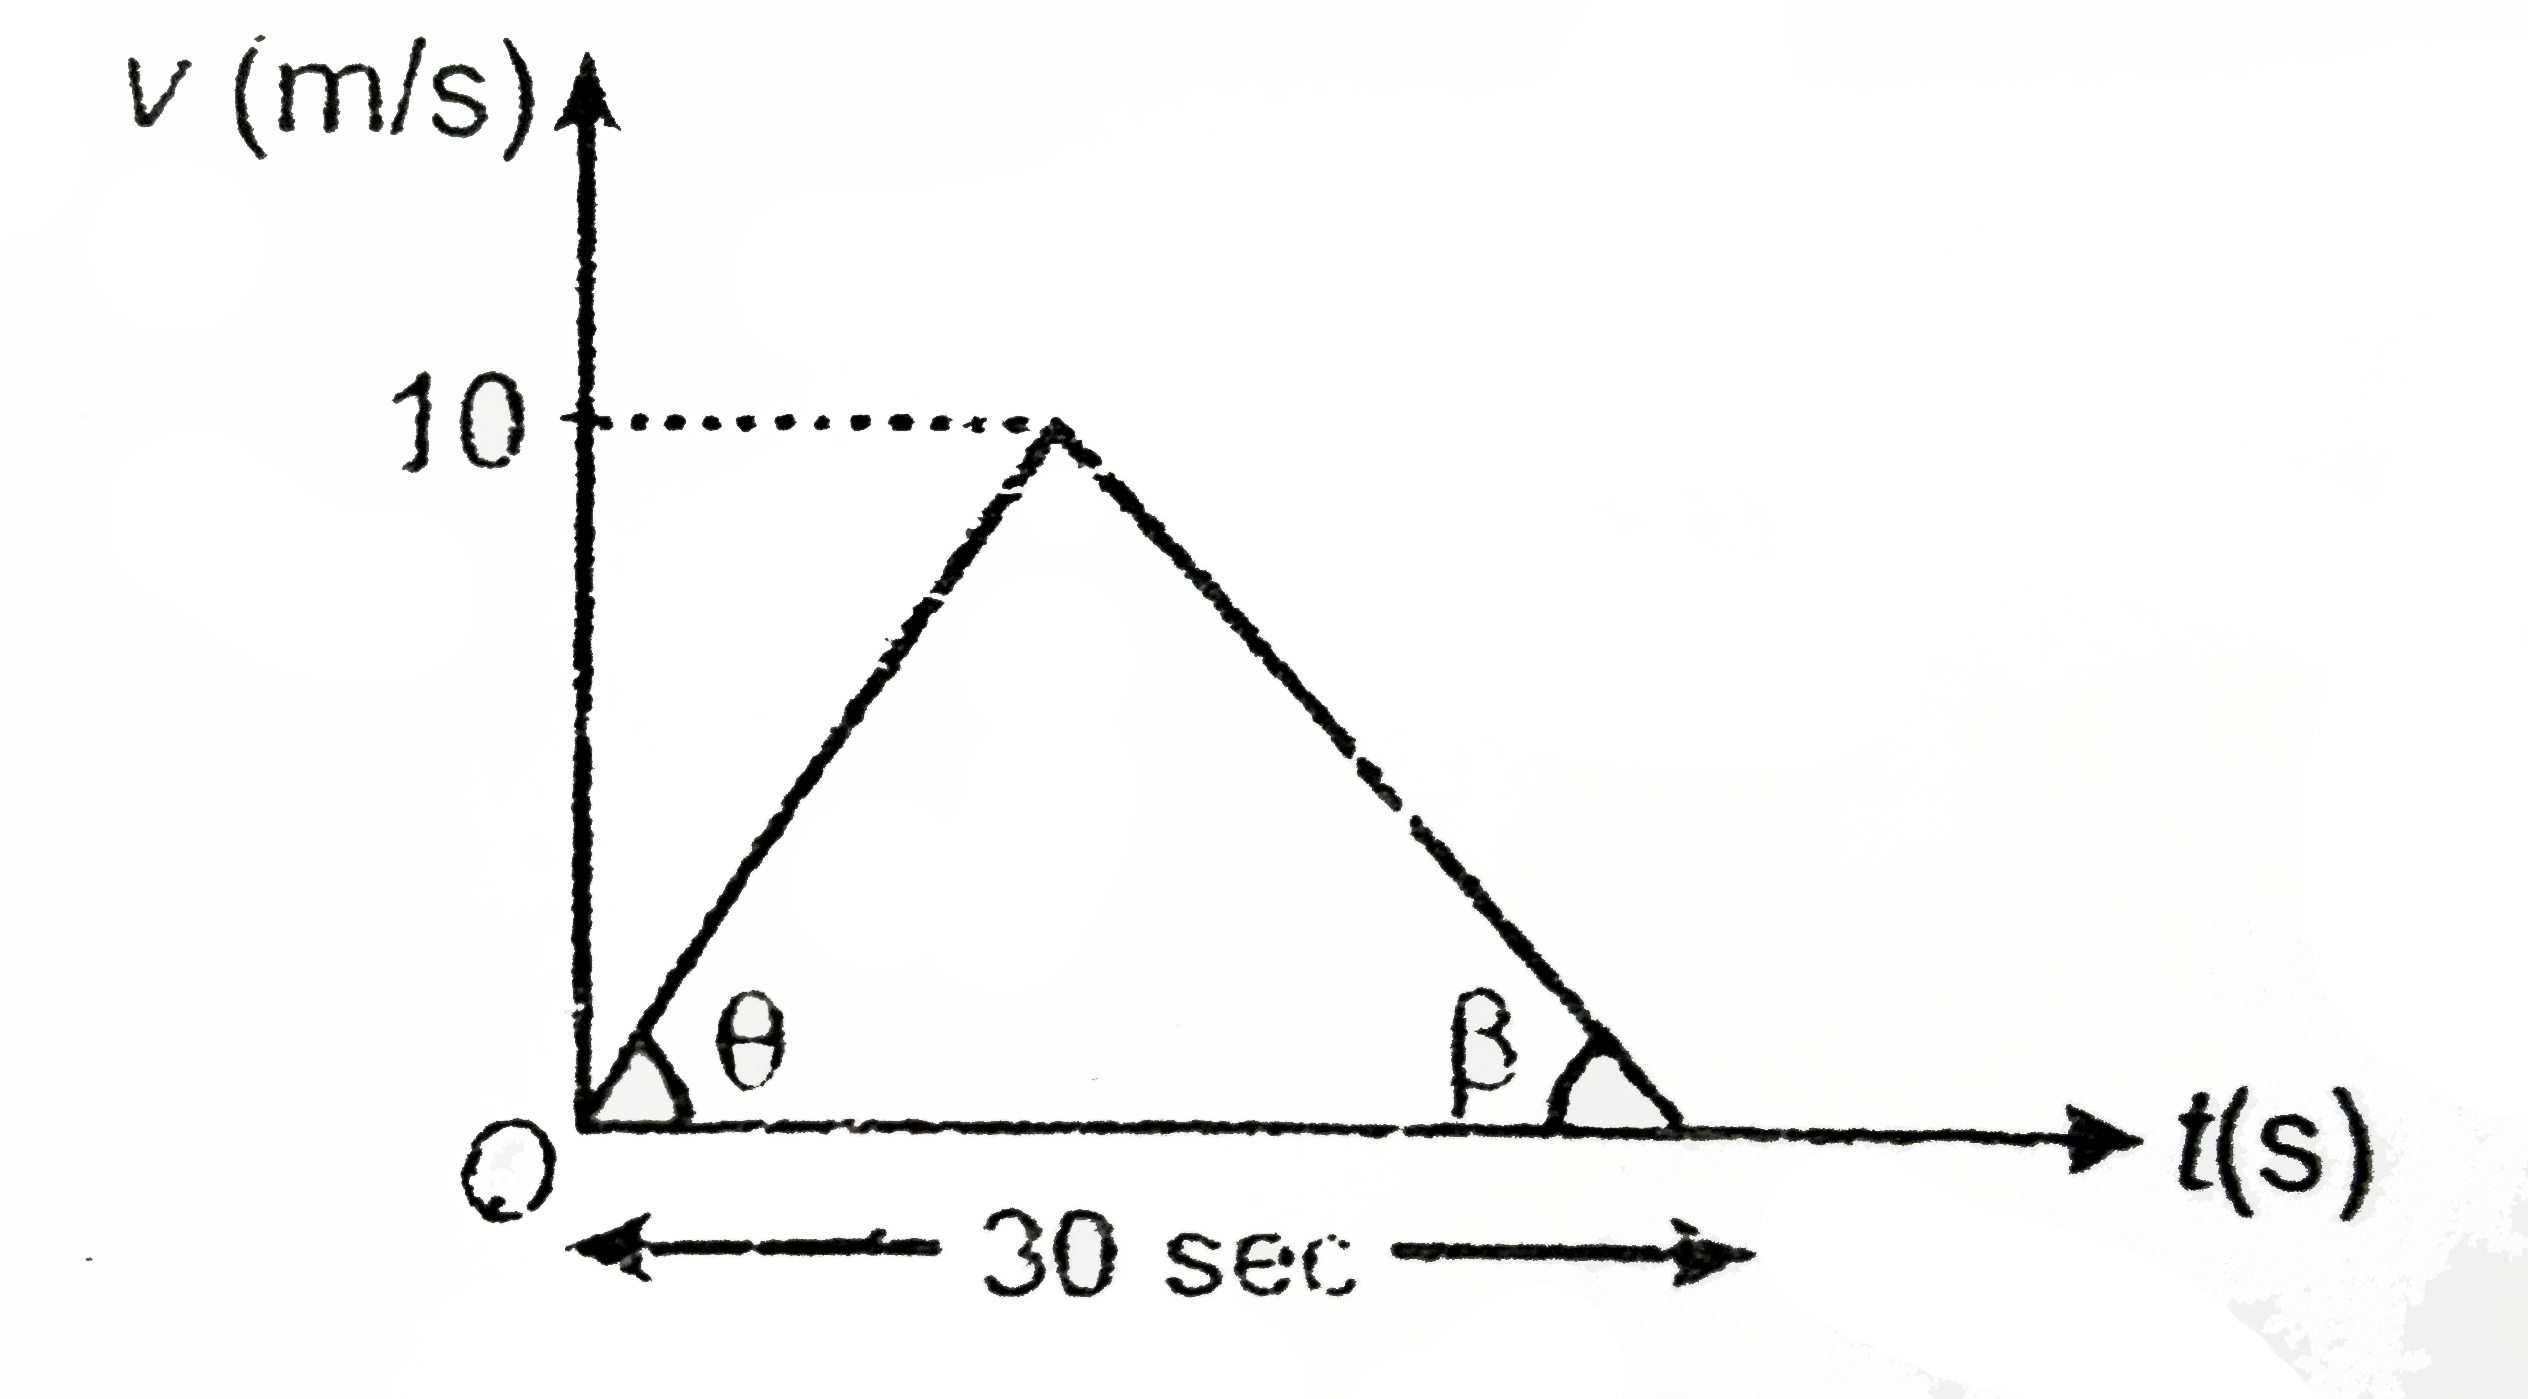
View SolutionA particle obeys the following v - t graph as shown. The average velocity over 30 s is

View SolutionThe acceleration-time (a−t) graph of a particle moving along straight line is as shown in figure. The time at which velocity of particle becomes equal to its initial velocity is

View Solution
