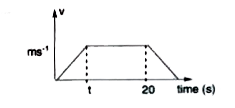
The velocity-time graph of a particle moving along a srtaight line is as shown in fig. The rate of acceleration and deceleration is constant and it is equal to 5ms−2. If the avrage velocity during the motion is 20ms−1, then

The distance travelled with uniform velocity is
375m
125 m
300 m
450 m
The correct Answer is:A
Topper's Solved these Questions
- KINEMATICSBOOK - AAKASH SERIESCHAPTER - KINEMATICSEXERCISE - LECTURE SHEET (EXERCISE-III) ( Graphs) (Matrix Matching Type Questions)
1 Videos
- KINEMATICSBOOK - AAKASH SERIESCHAPTER - KINEMATICSEXERCISE - LECTURE SHEET (EXERCISE-IV) (2D other than Projectile) (Straight Objective Type Questions)
5 Videos
- KINEMATICSBOOK - AAKASH SERIESCHAPTER - KINEMATICSEXERCISE - LECTURE SHEET (EXERCISE-III) ( Graphs) ( More than One Correct answer Type Questions)
1 Videos
- HORIZONTAL CIRCULAR MOTIONBOOK - AAKASH SERIESCHAPTER - HORIZONTAL CIRCULAR MOTIONEXERCISE - ADDITIONAL PRACTICE EXERCISE (PRACTICE SHEET (ADVANCED) Integer Type Questions)
3 Videos
- KINETIC THEORY OF GASESBOOK - AAKASH SERIESCHAPTER - KINETIC THEORY OF GASESEXERCISE - Practice Exercise
15 Videos
Similar Questions
The velocity-time graph of a particle moving along a straight line is shown is Fing. The rate of acceleration and deceleration is constant and it is equal to 5ms−2. If the a average velocity during the motion is 20ms−1, Then
 .
.
The distace travelled with uniform velcoty is .
View SolutionThe velocity-time graph of a particle moving along a straight line is shown is . The rate of acceleration and deceleration is constant and it is equal to 5ms−2. If the a average velocity during the motion is 20ms−1, Then
 .
.
The value of t is.
View Solution
Knowledge Check
The velocity-time graph of a particle moving along a straight line is shown is Fing. The rate of acceleration and deceleration is constant and it is equal to 5ms−2. If the a average velocity during the motion is 20ms−1, Then
 .
.
The distace travelled with uniform velcoty is .A375 mB125mC300mD450mThe velocity- time graph of the particle moving along a straight line is shown. The rate of acceleration and deceleration is constant and it is equal to 5ms−2. If the average velocity during the motion is 20ms−1, then the value of t is
 A3 secB5 secC10 secD12 sec
The velocity-time graph of a particle moving along a straight line is shown is . The rate of acceleration and deceleration is constant and it is equal to 5ms−2. If the a average velocity during the motion is 20ms−1, Then
 .
.
The value of t is.A5sB10sC20sD5√2s
The velocity-time graph of a particle moving along a straight line is shown is Fig. The rate of acceleration and deceleration is constant and it is equal to 5ms−2. If the a average velocity during the motion is 20ms−1, Then
 .
.
The maximum velocity of the particle is .
View SolutionThe velocity-time graph of a particle moving along a straight line is shown is Fig. The rate of acceleration and deceleration is constant and it is equal to 5ms−2. If the a average velocity during the motion is 20ms−1, Then
 .
.
The maximum velocity of the particle is .
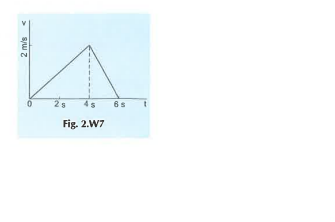
View SolutionThe velocity-time graph of a particle moving along a straight line is shown in Figure 2.W7.Is the motion uniform?

View SolutionThe acceleration time graph of a particle moving along a straight line is as shown in Fig.At what time the particle acquires its initial velocity?
View SolutionThe velocity-time graph of a particle moving along a straight line is shown is Fig. The rate of acceleration and deceleration is constant and it is equal to 5ms−2. If the a average velocity during the motion is 20ms−1, Then
 .
.
The maximum velocity of the particle is
View Solution
