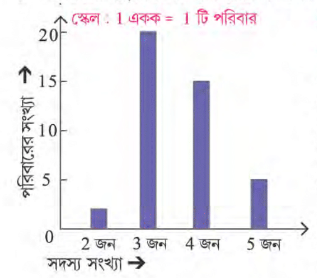
এই স্তম্ভ লেখচিত্র দেখো ও নীচের প্রশ্নের উত্তর খোঁজার চেষ্টা কর- এই 50টি পরিবারের মধ্যে সবচেয়ে বেশি পরিবারেরে সদস্য সংখ্যা কত লেখো| এইরকম পরিবারের সংখ্যা কত লেখো|
Step by step video & image solution for এই স্তম্ভ লেখচিত্র দেখো ও নীচের প্রশ্নের উত্তর খোঁজার চেষ্টা কর- এই 50টি পরিবারের মধ্যে সবচেয়ে বেশি পরিবারেরে সদস্য সংখ্যা কত লেখো| এইরকম পরিবারের সংখ্যা কত লেখো| by Maths experts to help you in doubts & scoring excellent marks in Class 7 exams.
Updated on:21/07/2023Topper's Solved these Questions
- আয়তক্ষেত্র ও বর্গক্ষেত্রের ক্ষেত্রফলBOOK - CHAAYA PRAKASHINI (BENGALI)CHAPTER - আয়তক্ষেত্র ও বর্গক্ষেত্রের ক্ষেত্রফলEXERCISE - EXERCISE
34 Videos
- অসন্ন মানBOOK - CHAAYA PRAKASHINI (BENGALI)CHAPTER - অসন্ন মানEXERCISE - EXERCISE
14 Videos
- উৎপাদকে বিশ্লেষণBOOK - CHAAYA PRAKASHINI (BENGALI)CHAPTER - উৎপাদকে বিশ্লেষণEXERCISE - EXERCISE
98 Videos
Similar Questions
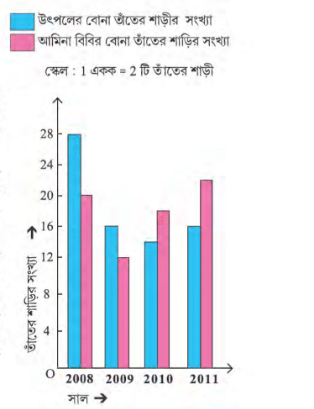
দ্বিস্তম্ভ লেখচিত্র দেখো ও নীচের প্রশ্নের উত্তর লেখার চেষ্টা কর- আবার কোন কোন বছরে আমিনাবিবি উৎপলের থেকে বেশি তাঁতের শাড়ি বুনেছে| আমিনা বিবি সবচেয়ে বেশি কোন বছরে উৎপলের থেকে বেশি শাড়ি বুনেছে দেখো|

View Solution3 টাকা 7 জন ছেলেমেয়েদের মধ্যে সমান ভাগে ভাগ করে দিই | হিসাব করে দেখো প্রত্যেকে কত পয়সা করে পাবে | (দুই দশমিক স্থান পর্যন্ত আসন্নমানে) |
View Solutionনীচের বীজগাণিতিক সংখ্যামালাগুলির উৎপাদকে বিশ্লেষণ করো : 7xy
View SolutionHow many lines of symmetry does the above figure have ?
View SolutionWhich of the following are correct chain isomers of butane ? (i)
View SolutionDetermine the point of symmetry of a regular hexagon.
View SolutionDtermine the images of the following figure about the given line :
View SolutionMatch the following Column A to Column B

View SolutionMatch the following Column A to Column B

View SolutionMatch the following Column A to Column B

View SolutionFind the area of the figure given below.

View SolutionThe area of the shaded part in the figure given below is ______.

View SolutionThe inequation represented by the graph given below is :
View SolutionThe inequation that best describes the graph given below is _________
View SolutionThe inequation that best describes the following graph is _________
View SolutionWhich inequations represent the shaded region in the given figure
View Solution
