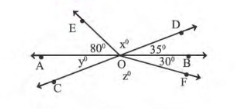
চিত্র থেকে x,y,z –এর মান নির্নয় করি|
Step by step video & image solution for চিত্র থেকে x,y,z –এর মান নির্নয় করি| by Maths experts to help you in doubts & scoring excellent marks in Class 8 exams.
Updated on:21/07/2023Topper's Solved these Questions
- বিপ্রতীপ কোণBOOK - CHAAYA PRAKASHINI (BENGALI)CHAPTER - বিপ্রতীপ কোণEXERCISE - EXERCISE
13 Videos
- বিজগানেতিক সংখ্যামালার উৎপাদক বিশ্লেষণBOOK - CHAAYA PRAKASHINI (BENGALI)CHAPTER - বিজগানেতিক সংখ্যামালার উৎপাদক বিশ্লেষণEXERCISE - EXERCISE
54 Videos
- বীজগাণিতিক সংখ্যামালাগুলির গ.সা.গু ও ল.সা.গু. BOOK - CHAAYA PRAKASHINI (BENGALI)CHAPTER - বীজগাণিতিক সংখ্যামালাগুলির গ.সা.গু ও ল.সা.গু. EXERCISE - EXERCISE
37 Videos
Similar Questions
দুটি সরলরেখা PQ ও RS পরস্পরকে O বিন্দুতে ছেদ করলে যে বিপ্রতীপ কোণগুলি তৈরি হয় তাদের আঁকো ও নাম লেখো |
View Solution(x−1)(x+3)(x−2)(x−6)+96 -কে উৎপাদকে বিশ্লেষণ করার চেষ্টা করো |
View Solutionবীজগাণিতিক সংখ্যামালাটির গ.সা.গু নির্ণয় করো : 4a2b2,20ab2
View SolutionHow many lines of symmetry does the above figure have ?
View SolutionWhich of the following are correct chain isomers of butane ? (i)
View SolutionDetermine the point of symmetry of a regular hexagon.
View SolutionDtermine the images of the following figure about the given line :
View SolutionMatch the following Column A to Column B

View SolutionMatch the following Column A to Column B

View SolutionMatch the following Column A to Column B

View SolutionFind the area of the figure given below.

View SolutionThe inequation represented by the graph given below is :
View SolutionThe inequation that best describes the graph given below is _________
View SolutionThe inequation that best describes the following graph is _________
View SolutionWhich inequations represent the shaded region in the given figure
View SolutionIn Fig, find the value of x.
ltimg src="https://d10lpgp6xz60nq.cloudfront.net/physics_images/PS_MATH_IX_C12_S01_032_Q01.png" width="80%"gt
View Solution
