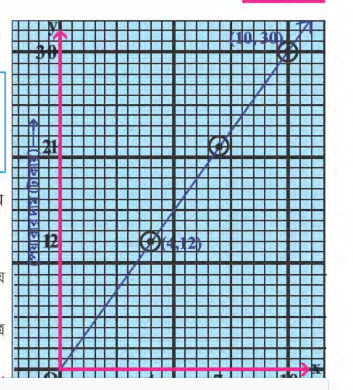
আজ আমরা ট্যাক্সি ভাড়া করে শালবনীতে যাচ্ছি | সেখানে আমার মামার বাড়ি | সকাল 7 টায় রওনা দিয়েছি | প্রতি ঘন্টায় আমাদের গাড়ি কতটা পথ অতিক্রম করল তার তথ্য আমি নিচের ছকে লিখেছি | ছক কাগজে এই তথ্যগুলির লেখচিত্র অঙ্কন করো | লেখচিত্র থেকে সকাল 10 টা 30 মিনিট পর্যন্ত গাড়িটি কতপথ অতিক্রম করেছিল দেখো এবং 125 কিমি দূরত্ব কখন অতিক্রম করেছিল দেখো |
Step by step video & image solution for আজ আমরা ট্যাক্সি ভাড়া করে শালবনীতে যাচ্ছি | সেখানে আমার মামার বাড়ি | সকাল 7 টায় রওনা দিয়েছি | প্রতি ঘন্টায় আমাদের গাড়ি কতটা পথ অতিক্রম করল তার তথ্য আমি নিচের ছকে লিখেছি | ছক কাগজে এই তথ্যগুলির লেখচিত্র অঙ্কন করো | লেখচিত্র থেকে সকাল 10 টা 30 মিনিট পর্যন্ত গাড়িটি কতপথ অতিক্রম করেছিল দেখো এবং 125 কিমি দূরত্ব কখন অতিক্রম করেছিল দেখো | by Maths experts to help you in doubts & scoring excellent marks in Class 8 exams.
Updated on:21/07/2023Topper's Solved these Questions
Similar Questions
পাশের ছকের লেখচিত্র দেখো ও নীচের প্রশ্নটির উত্তর খোঁজো | 4 টি পেয়ারার দাম কত লেখো |

View Solutionনীচের সমীকরণটি সমাধান করো ও বীজগুলি pq [(q≠0)যেখানে p,q পূর্ণসংখ্যা] আকারে প্রকাশ করো- 7x=14
View Solutionআমার কাছে 50 টাকা আছে | 50 টাকার 12% আমি স্কুলে পেন কিনতে খরচ করলাম | আমি কত টাকার পেন কিনলাম হিসাব করো |
View SolutionHow many lines of symmetry does the above figure have ?
View SolutionWhich of the following are correct chain isomers of butane ? (i)
View SolutionDetermine the point of symmetry of a regular hexagon.
View SolutionDtermine the images of the following figure about the given line :
View SolutionMatch the following Column A to Column B

View SolutionMatch the following Column A to Column B

View SolutionMatch the following Column A to Column B

View SolutionFind the area of the figure given below.

View SolutionThe area of the shaded part in the figure given below is ______.

View SolutionThe inequation represented by the graph given below is :
View SolutionThe inequation that best describes the graph given below is _________
View SolutionThe inequation that best describes the following graph is _________
View SolutionWhich inequations represent the shaded region in the given figure
View Solution
