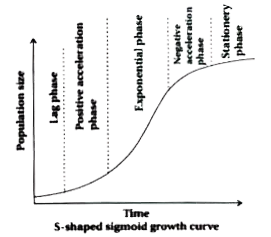
With the help of suitable diagram describe the logistic population growth curve.
Text Solution
• It is formed of 5 phases - lag phase, positive acceleration phase, exponential phase, negative acceleration phase and stationary phase.
• Finally, the population shows zero growth rate as birth rate equals death rate
• Example : Yeast cells in the culture medium

|
Topper's Solved these Questions
- ORGANISMS AND POPULATIONSBOOK - KUMAR PRAKASHANCHAPTER - ORGANISMS AND POPULATIONSEXERCISE - SECTION - E (SOLUTION OF NCERT EXEMPLAR) (MULTIPLE CHOICE QUESTIONS)
20 Videos
- ORGANISMS AND POPULATIONSBOOK - KUMAR PRAKASHANCHAPTER - ORGANISMS AND POPULATIONSEXERCISE - SECTION - E (SOLUTION OF NCERT EXEMPLAR) (VERY SHORT ANSWER TYPE QUESTIONS)
19 Videos
- ORGANISMS AND POPULATIONSBOOK - KUMAR PRAKASHANCHAPTER - ORGANISMS AND POPULATIONSEXERCISE - SECTION - C (OBJECTIVE QUESTIONS ANSWERS)
15 Videos
- MOLECULAR BASIC OF INHERITANCEBOOK - KUMAR PRAKASHANCHAPTER - MOLECULAR BASIC OF INHERITANCEEXERCISE - SECTION - F (MULTIPLE CHOICE QUESTIONS (MCQs))(MCQs ASKED IN COMPETITIVE EXAM)
78 Videos
- PRINCIPLES OF INHERITANCE AND VARIATION BOOK - KUMAR PRAKASHANCHAPTER - PRINCIPLES OF INHERITANCE AND VARIATION EXERCISE - SECTION -F (MULTIPLE CHOICE QUESTIONS (MCQS)) (MCQs ASKED IN COMPETITIVE EXAM)
38 Videos
Similar Questions
Knowledge Check
Which of the following is not an assumption of the logistic model for population growth?
AMembers of the population complete for resources at high densityBAll individuals have the same effect on population growthCPopulation growth rate increases as the size of the population approaches the carrying capacityDThere is no time lag between birth and the time an organism begins to affect population growth(A) : When resources become progressively limiting, the population growth pattern turns logistic.
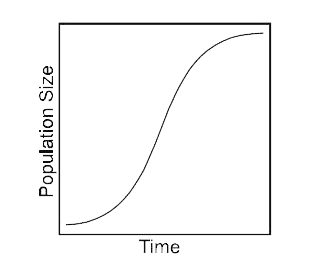
(R) : Population growth is ultimately limited by the carrying capacity of the environment.AIf both (A) and (R) are true but (R) is not the correct explanation of (A).BIf both (A) and (R) are true and (R) is the correct explanation of (A).CIf (A) is true but (R) is false.DIf both (A) and (R) are false.Many population colonising a new habitat show a logistic population growth pattern over time, as shown in the figure below.

In such a population, the POPULATION growth rateAstays constant over timeBincreases and then reaches an asymptoteCdecreases over timeDincreases to a maximum and then decrease
With the help of a suitable diagram describe the structure of a nucleosome.
View SolutionWith the help of a suitable diagram, describe the structure and function of a neuron.
View SolutionWhat is spermatogenesis? With the help of a suitable diagram describe different steps involved in this process.
View SolutionWith the help of suitable diagrams, explain how the age structures determine the trend of population ?
View SolutionWith the help of suitable diagrams, explain how the age structures determine the trend of population ?
View Solution
