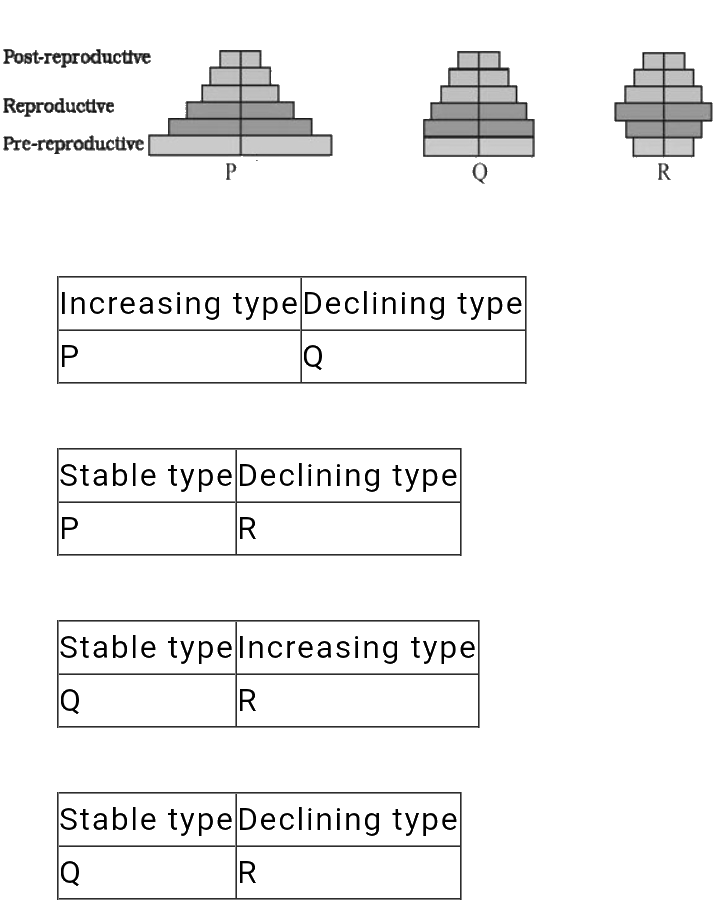
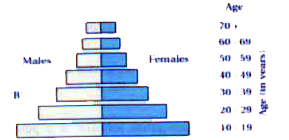
A country with a high rate of population growth took measures to reduce it. The figure below shows age- sex pyramid of populations A and B twenty years apart. Select the correct interpretation about them.

"A" is the earlier pyramid and no change has occurred in the growth rate
"A" is more recent and shows slight reduction in the growth rate.
"B" is the earlier pyramid and shows stabilised growth rate.
"B" is more recent showing that population is very young.
The correct Answer is:B
Topper's Solved these Questions
- ORGANISMS AND POPULATIONSBOOK - KUMAR PRAKASHANCHAPTER - ORGANISMS AND POPULATIONSEXERCISE - SECTION - F (MULTIPLE CHOICE QUESTIONS)(MCQs ASKED IN COMPETITIVE EXAM)
103 Videos
- ORGANISMS AND POPULATIONSBOOK - KUMAR PRAKASHANCHAPTER - ORGANISMS AND POPULATIONSEXERCISE - SECTION - F (MULTIPLE CHOICE QUESTIONS)(MCQs FROM DARPAN BASED ON TEXTBOOK)
1 Videos
- MOLECULAR BASIC OF INHERITANCEBOOK - KUMAR PRAKASHANCHAPTER - MOLECULAR BASIC OF INHERITANCEEXERCISE - SECTION - F (MULTIPLE CHOICE QUESTIONS (MCQs))(MCQs ASKED IN COMPETITIVE EXAM)
78 Videos
- PRINCIPLES OF INHERITANCE AND VARIATION BOOK - KUMAR PRAKASHANCHAPTER - PRINCIPLES OF INHERITANCE AND VARIATION EXERCISE - SECTION -F (MULTIPLE CHOICE QUESTIONS (MCQS)) (MCQs ASKED IN COMPETITIVE EXAM)
38 Videos
Similar Questions
Knowledge Check
A country with a high rate of population growth took measures to reduce it. The figure below shows are sex pyramids of populations. A and B twenty years apart. Select the correct interpretation about them.
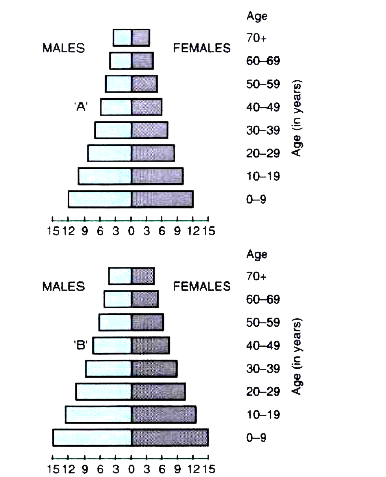
InterpretationsAA' is more recent and shows slight reduction in the growth rateB'B' is earlier pyramid and shows stabilised growth rateCB' is more recent showing that population is very youngD'A' is the earlier pyramid and no change has occurred in the growth rateRepresentation of age pyramids for human population is given below. Identify A, B and C by selecting the correct option:
 AABCDecliningStableExpandingBABCStableExpandingDecliningCABCExpandingStableDecliningDABCStableDecliningExpanding
Age-sex sturcture of a population can be depicted in the form of a pyramid by plotting the percentage of population of each sex in each age class. Two age sex pyramids are given here.
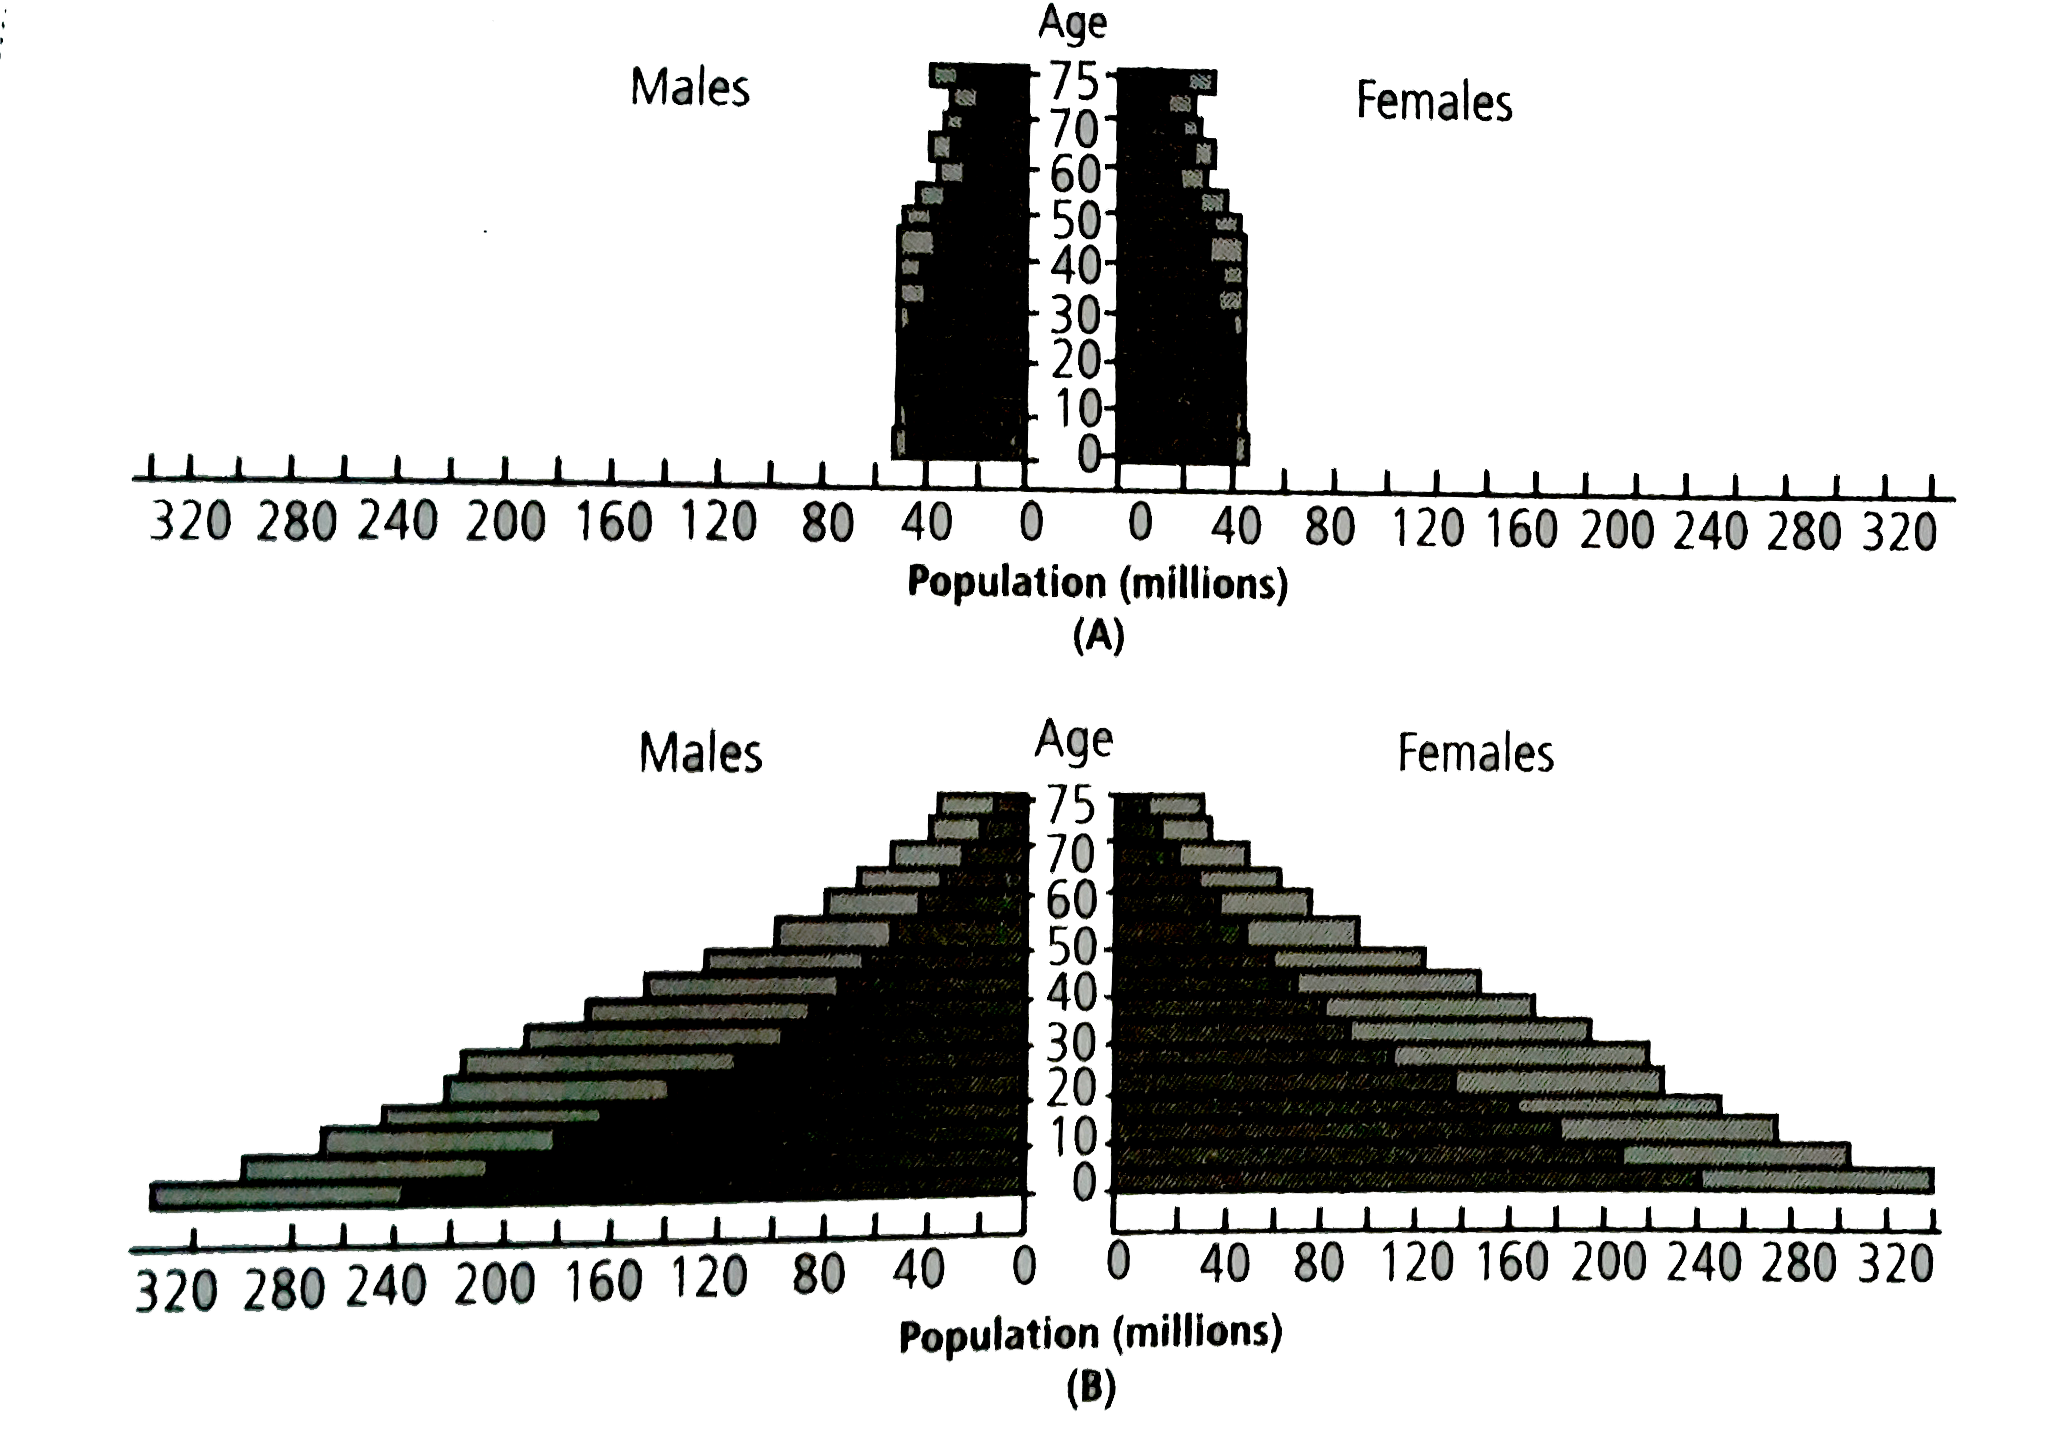
Study carefully the above age-sex pyramids and select the correct statements regarding these.AA represents the age-sex pyramid for a developed country and B represents the age-sex pyramid for a developing country.BB is a much less steep pyramid, representing a radpdly growing population, like that of india, as it has a much larger number of young people.CA is a stepper pyramid, which represents a nearly stable populationDAll of these
Representation of age pyramids for the human population is given below. Identify A, B, and C by selecting the correct option .
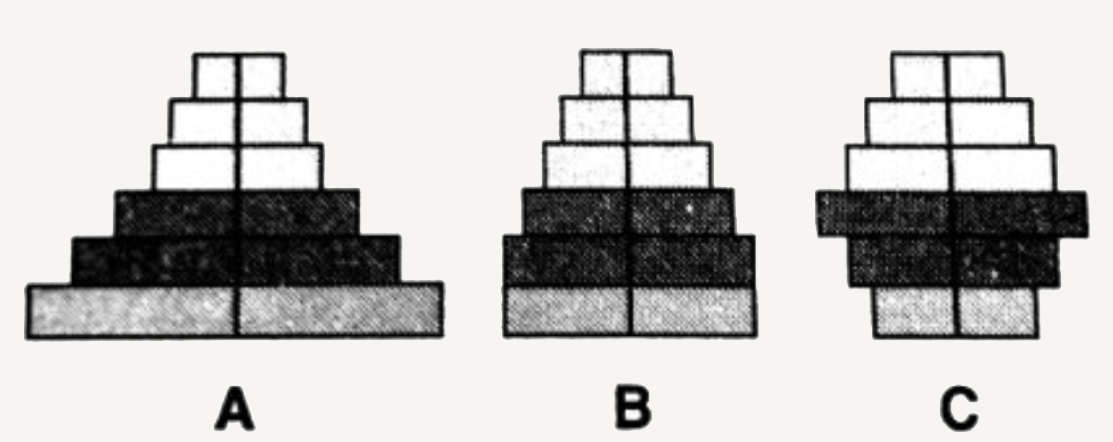
View SolutionRepresentation of age pyramids for the human population is given below. Identify A, B, and C by selecting the correct option .

View SolutionThe births and deaths of four populations A, B, C and D in a year are given below. Which population has the highest growth rate?
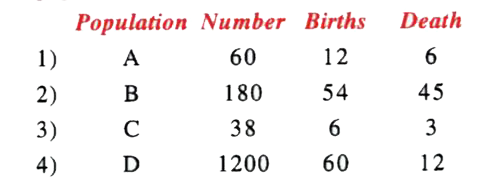
View SolutionAge-sex sturcture of a population can be depicted in the form of a pyramid by plotting the percentage of population of each sex in each age class. Two age sex pyramids are given here.

Study carefully the above age-sex pyramids and select the correct statements regarding these.
View SolutionMany population colonising a new habitat show a logistic population growth pattern over time, as shown in the figure below.
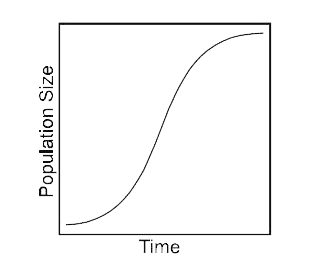
In such a population, the POPULATION growth rate
View Solution

