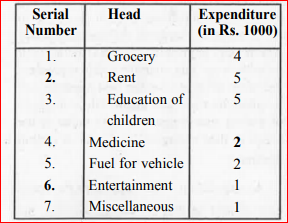
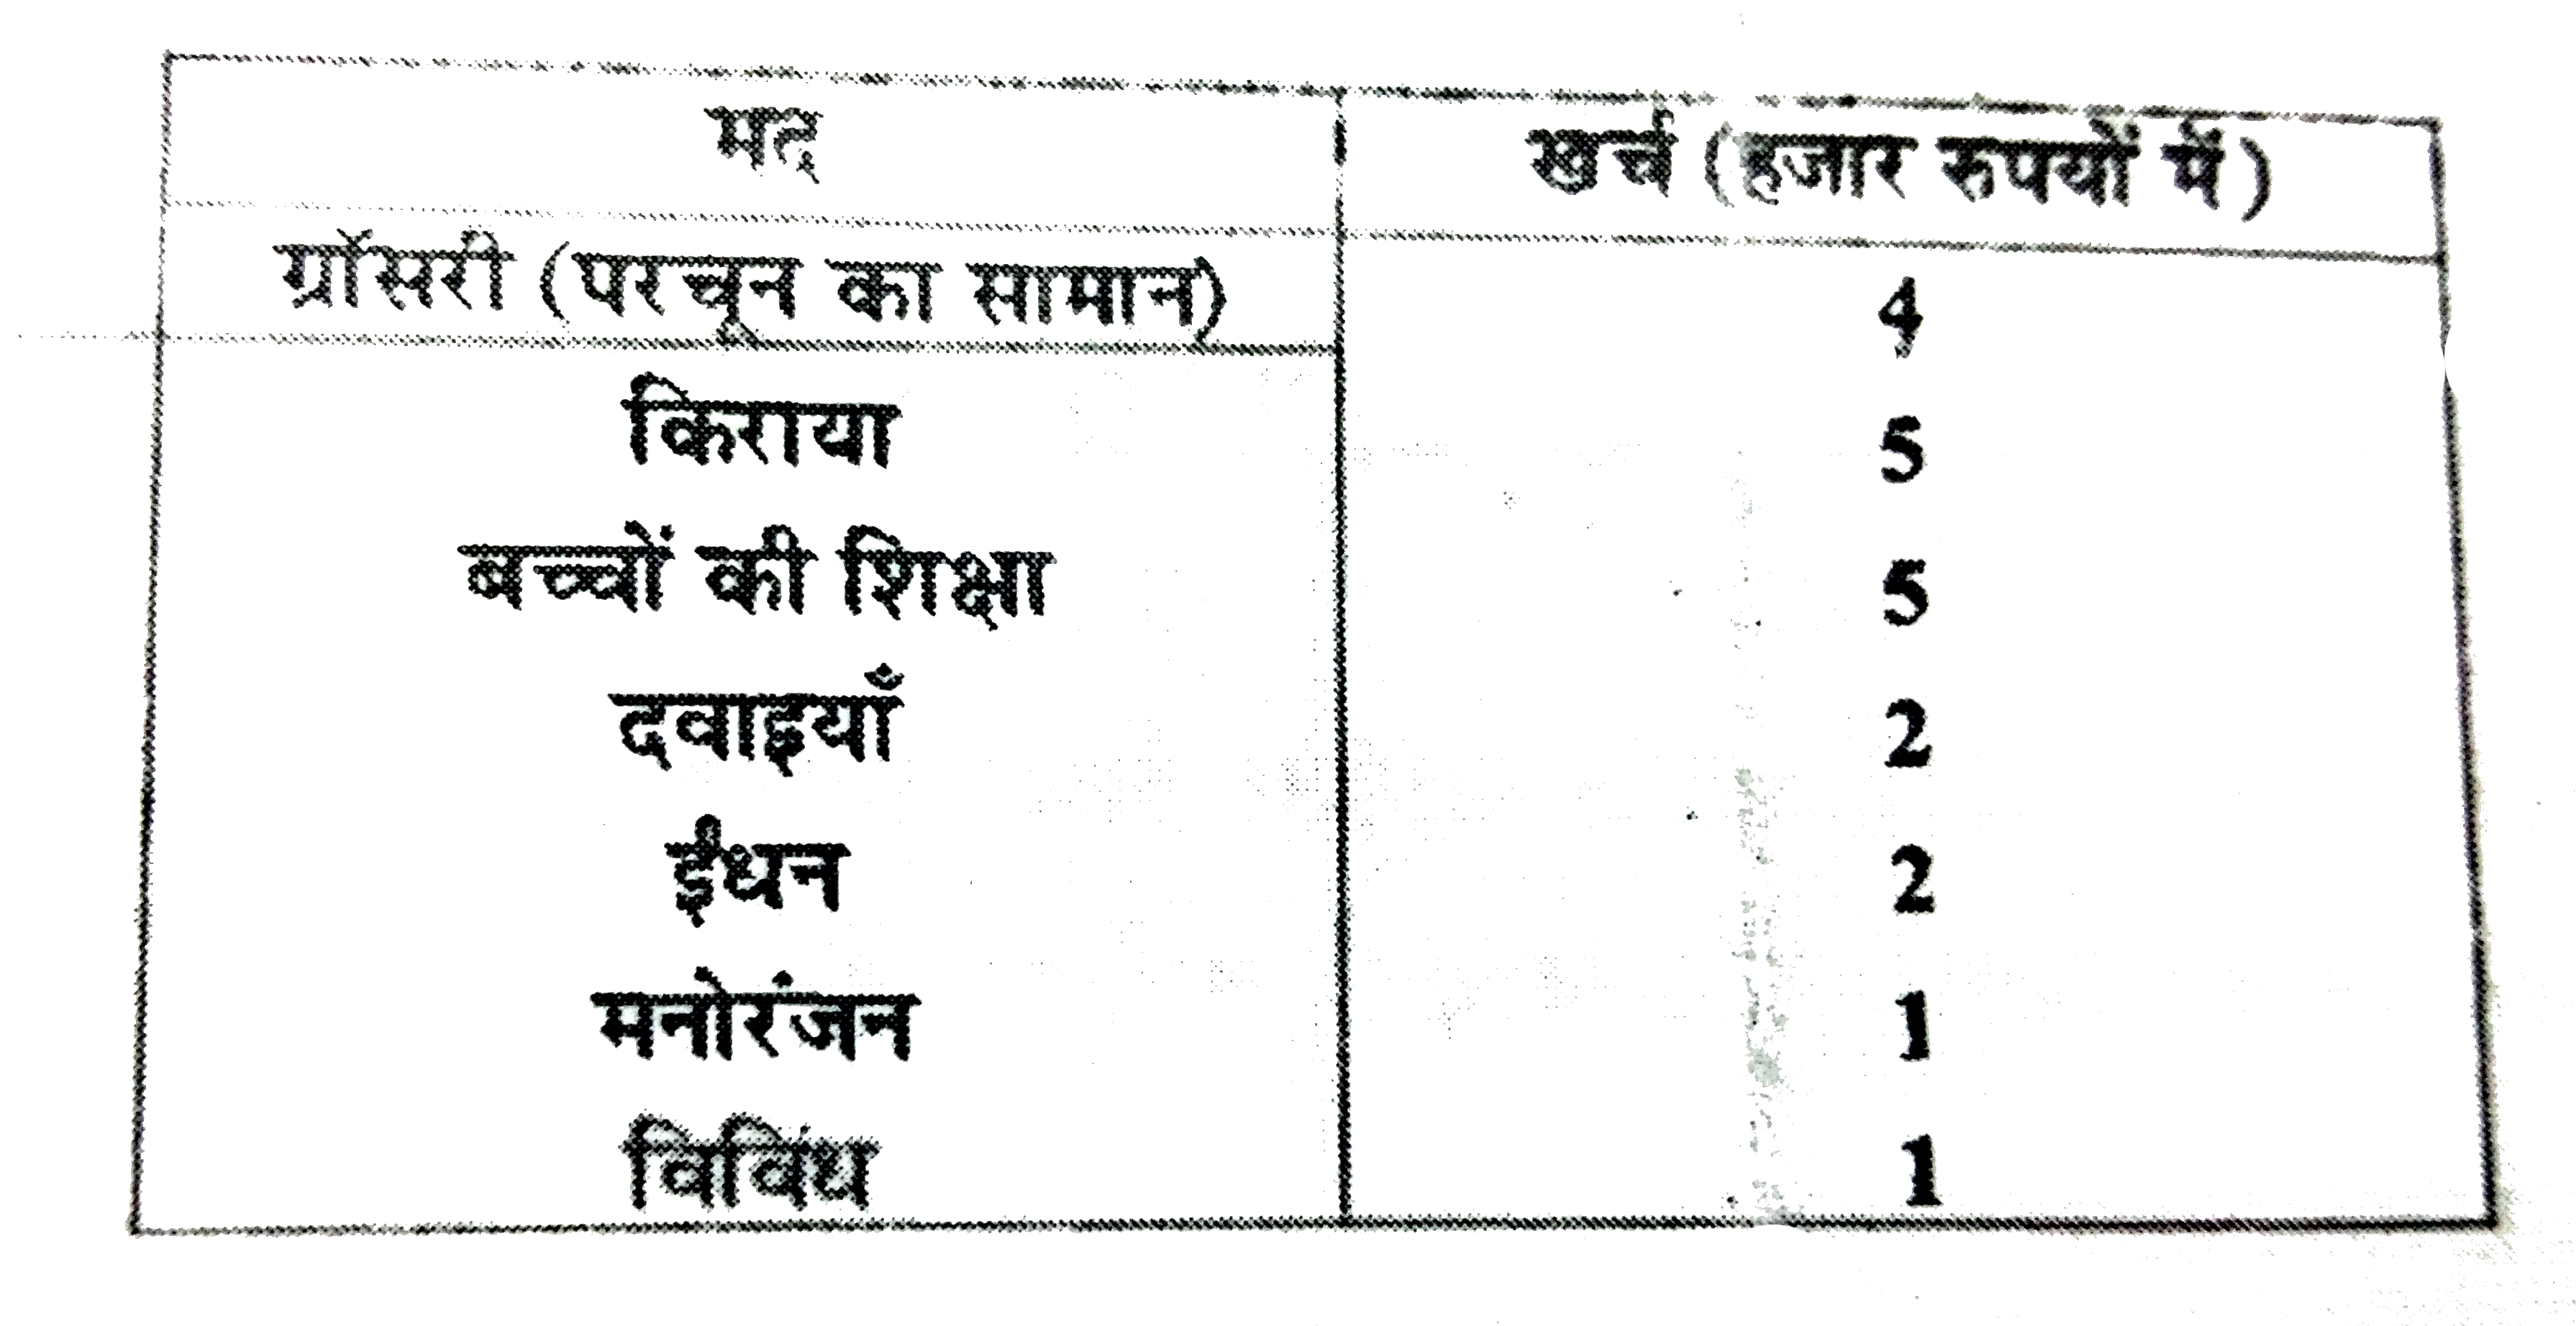
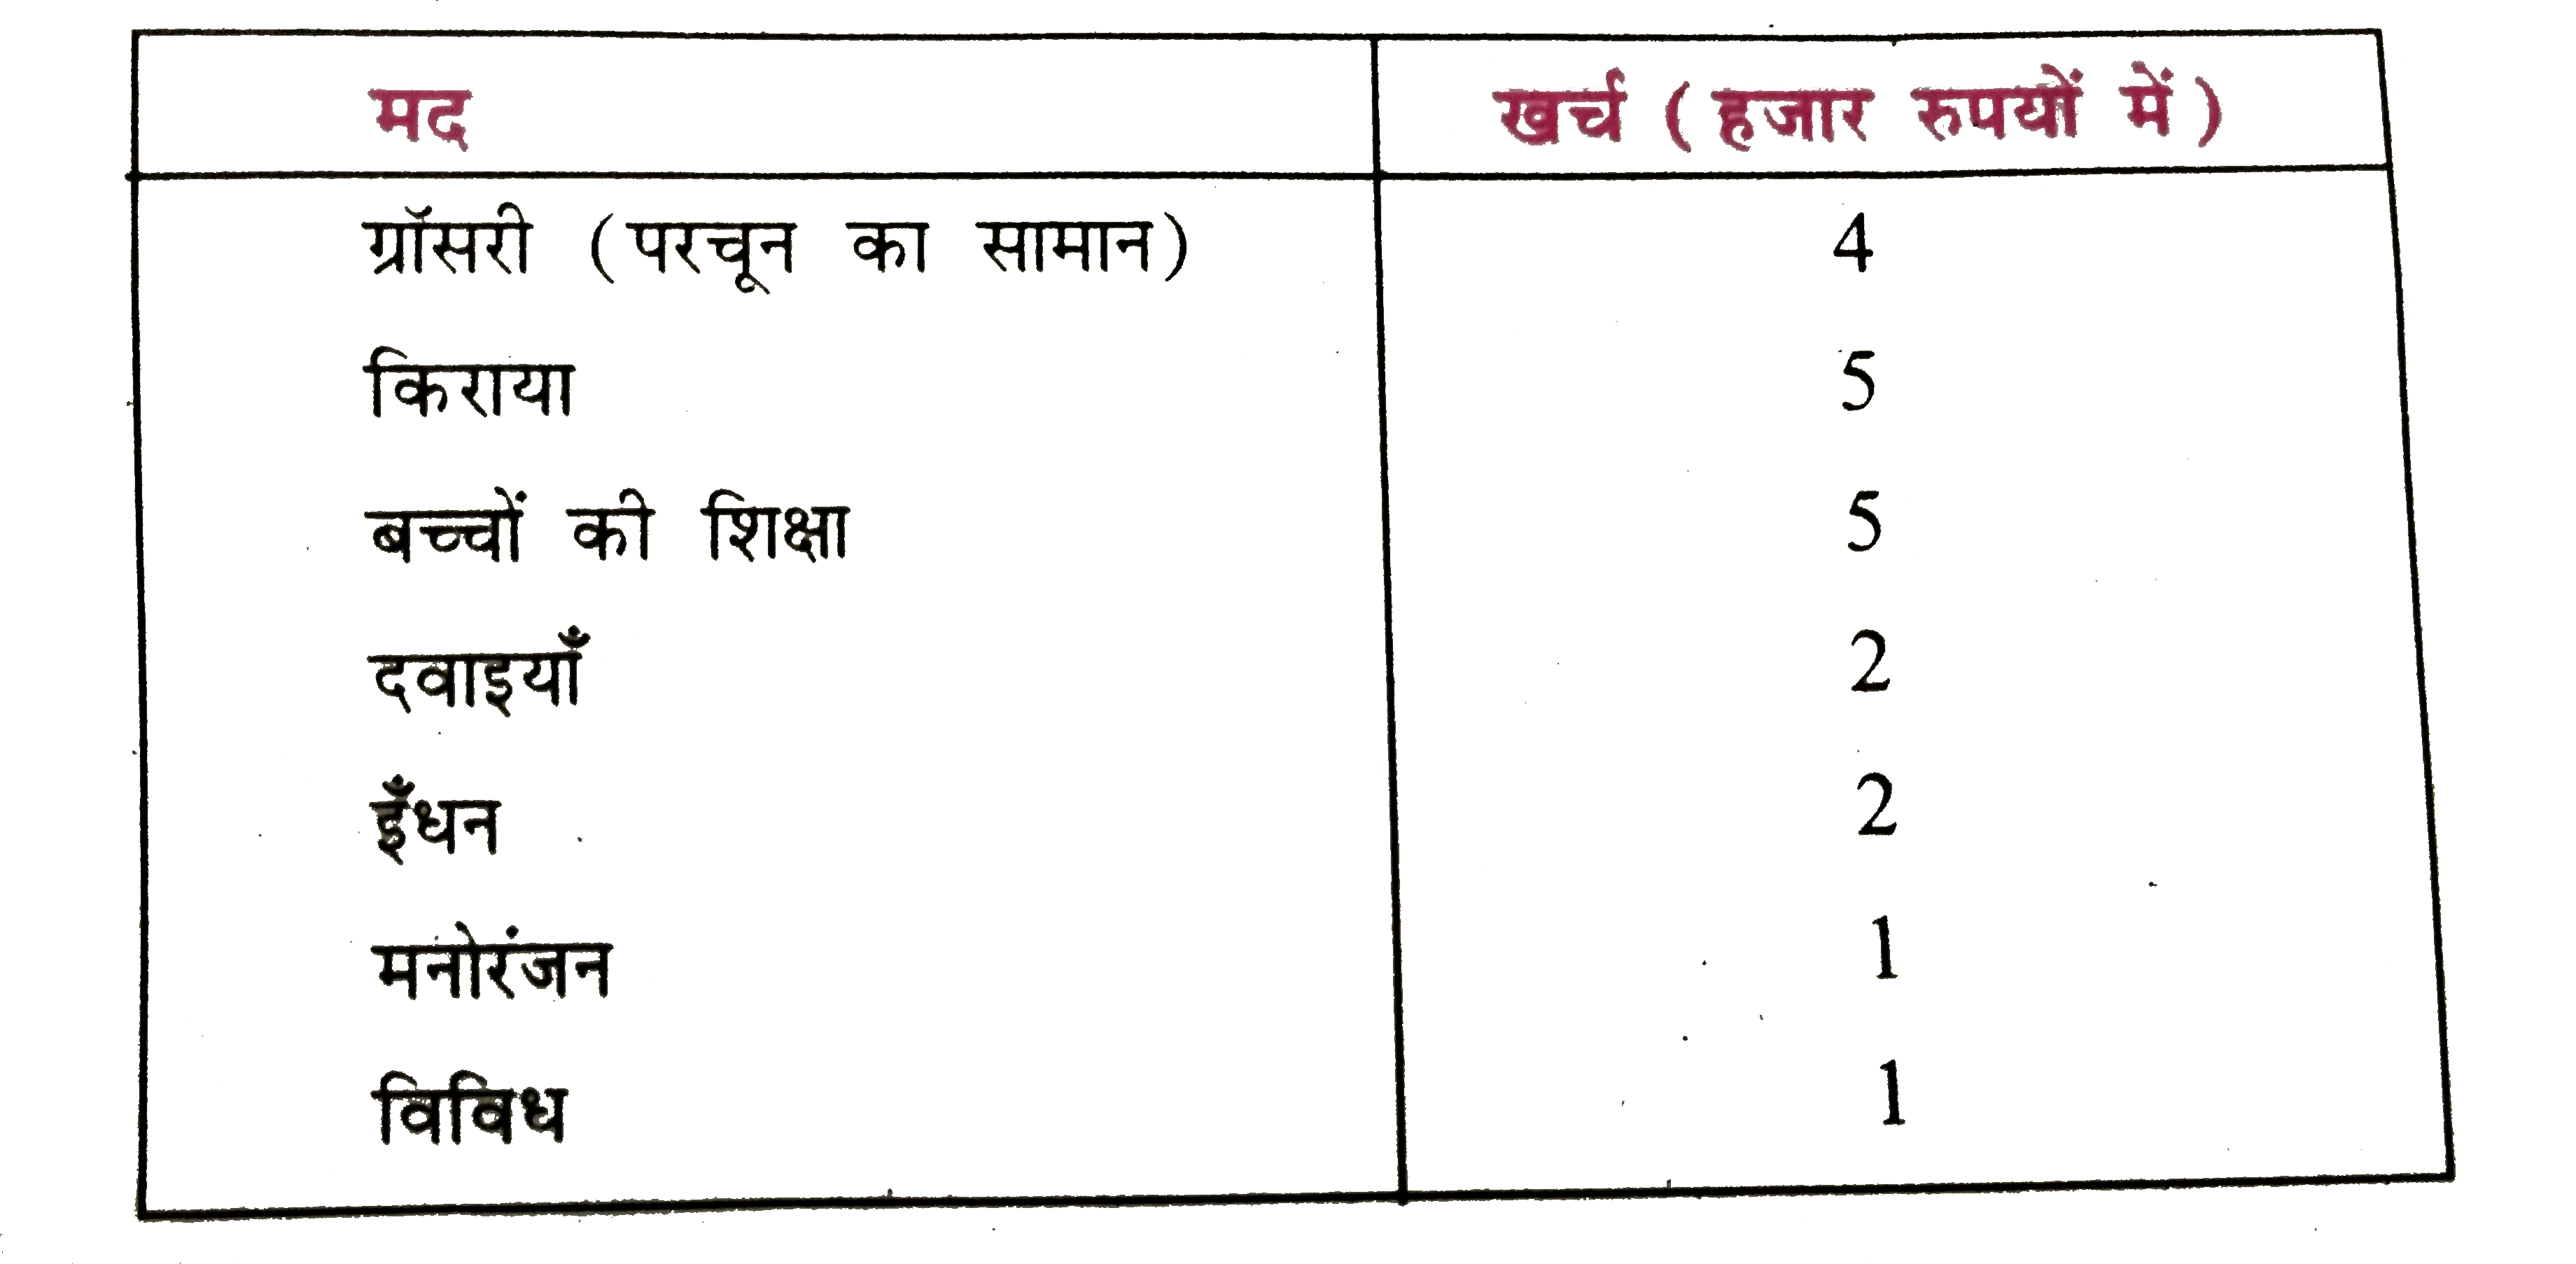
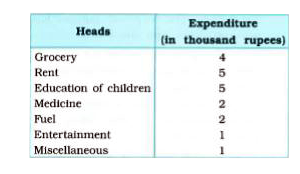
A family with monthly income of Rs. 20,000 had planned the following expenditures under various heads :
 Draw a bar graph for the above data.Solution in Punjabi
Step by step video & image solution for A family with monthly income of Rs. 20,000 had planned the following expenditures under various heads : Draw a bar graph for the above data. by Maths experts to help you in doubts & scoring excellent marks in Class 11 exams.
Updated on:21/07/2023Similar Questions
The inequation represented by the graph given below is :
View SolutionThe inequation that best describes the graph given below is _________
View SolutionThe inequation that best describes the following graph is _________
View Solutionएक परिवार ने जिसकी मासिक आय Rs 20000 है, विभिन्न मदों के अंतर्गत हर महीने होने वाले खर्च की योजना बनाई थी :

ऊपर दिए गए आँकड़ों का एक दंड आलेख बनाइए ।
View Solutionएक परिवार ने जिसकी मासिक आय 20000 रु है, विभिन्न पदो के अंतर्गत हर महीने होने वाले खर्च की योजना बनाई थी :

ऊपर दिए गए आँकड़ो का एक दंड आलेख बनाइए।
View SolutionA family with a monthly income of Rs 20,000 had planned the following expenditures per month under various heads
View SolutionA family with a monthly income of Rs. 20,000 had planned the following expenditures per month unders various heads :

Draw a bar graph for the data above.
View Solution
