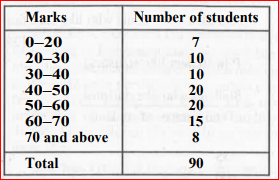
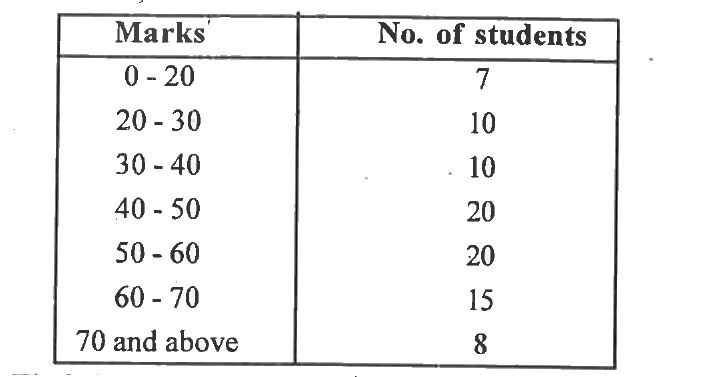
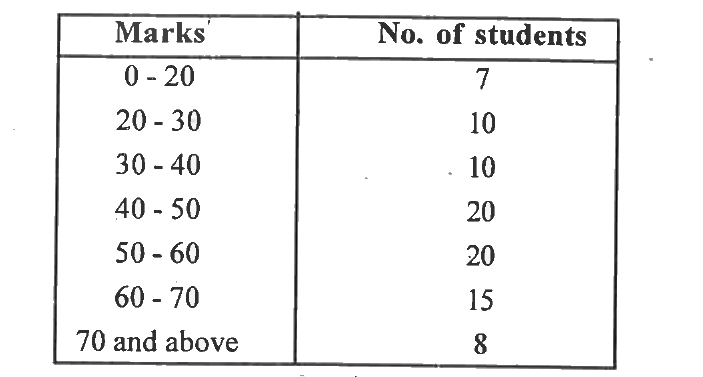
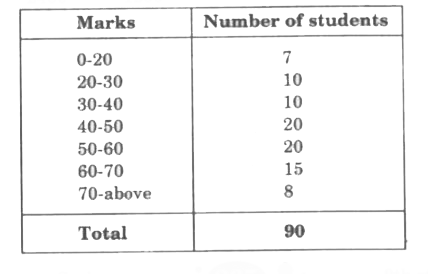
A teacher analyses the performance of two sections of students in a mathematics test of 100 marks given in the following table :
 : Find the probability that a student obtained less than 20 marks in the mathematics test.Solution in Punjabi
Step by step video & image solution for A teacher analyses the performance of two sections of students in a mathematics test of 100 marks given in the following table : : Find the probability that a student obtained less than 20 marks in the mathematics test. by Maths experts to help you in doubts & scoring excellent marks in Class 11 exams.
Updated on:21/07/2023Similar Questions
The inequation that best describes the graph given below is _________
View SolutionThe inequation that best describes the following graph is _________
View SolutionA teacher analyses the performance of two sections of students in a mathematics test of 100 marks given in the following table.

Find the probability that a student obtained less than 20 in the mathematics test.
View SolutionA teacher analyses the performance of two sections of students in a mathematics test of 100 marks given in the following table.

Find the probability that a student obtained marks 60 or above.
View Solution
(i) Find the probability that a student obtained less than 20% in the mathematics test.
(ii) Find the probability that a student obtained marks 60 or above.
View SolutionIn the given fig. If DE||BC Find EC.
ltimg src="https://d10lpgp6xz60nq.cloudfront.net/physics_images/MATH_241_X_SQP_E01_021_Q01.png" width="80%"gt
View SolutionFind the probability that a student obtained marks 60 or above.
View Solution
