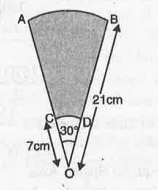
AB and CD are respectively arcs of two concentric circles of radii 21 cm and 7 cm and centre O. If ZAOB = , find the area of the shaded region.
 Solution in Punjabi
Step by step video & image solution for AB and CD are respectively arcs of two concentric circles of radii 21 cm and 7 cm and centre O. If ZAOB = 30^@, find the area of the shaded region. by Maths experts to help you in doubts & scoring excellent marks in Class 10 exams.
Updated on:21/07/2023Topper's Solved these Questions
Similar Questions
A bicycle wheel makes 500 revolutions in moving 11 km. Find the diameter of the wheel.
View SolutionRestate the following statements with appropriate conditions, so that they become true. : The diagonals of a quadrilateral bisect each otther.
View SolutionFind out which of the following sequences are arithmetic progressions. For those which are arithmetic progressions, find out the common difference. :- 3,6,12,24,….
View SolutionIn the given figure (not to scale), O is the centre of the circle. A,B,C and D are concyclic and AB=CD . If /_MON =120^(@) , then find /_ OPN .
View SolutionDetermine the point of symmetry of a regular hexagon.
View SolutionIn the figure above (not to scale), ¯¯¯¯¯¯AB⊥¯¯¯¯¯¯CDandAD is the bisector of ∠BAE.AB=3cm and AC=5cm. Find CD.
View SolutionIn the given figure, AB is a diameter, O is the center of the circle and ∠OCB=50∘ then find ∠DBC.
View SolutionFind the area of the shaded region, given that the radius of each circle is equal to 5 cm.
View SolutionMatch the following Column A to Column B

View SolutionMatch the following Column A to Column B

View SolutionMatch the following Column A to Column B

View SolutionThe area of the shaded part in the figure given below is ______.

View SolutionThe inequation represented by the graph given below is :
View SolutionThe inequation that best describes the graph given below is _________
View SolutionThe inequation that best describes the following graph is _________
View SolutionWhich inequations represent the shaded region in the given figure
View Solution
