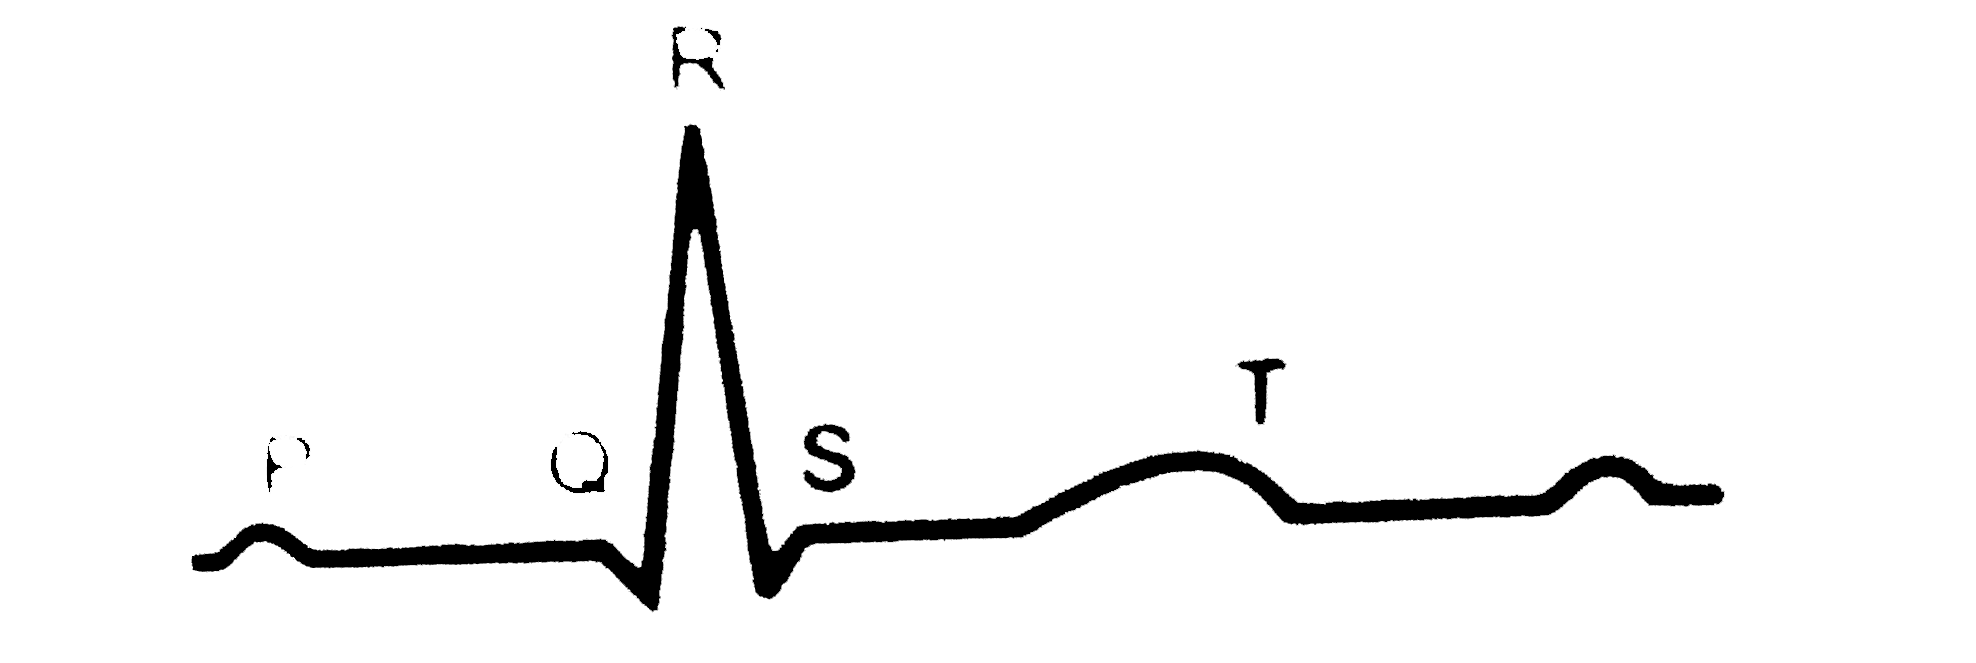
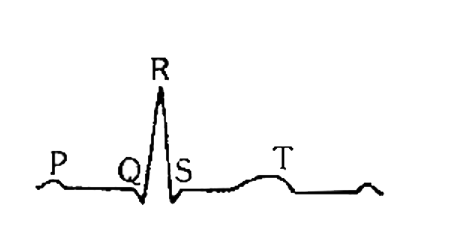
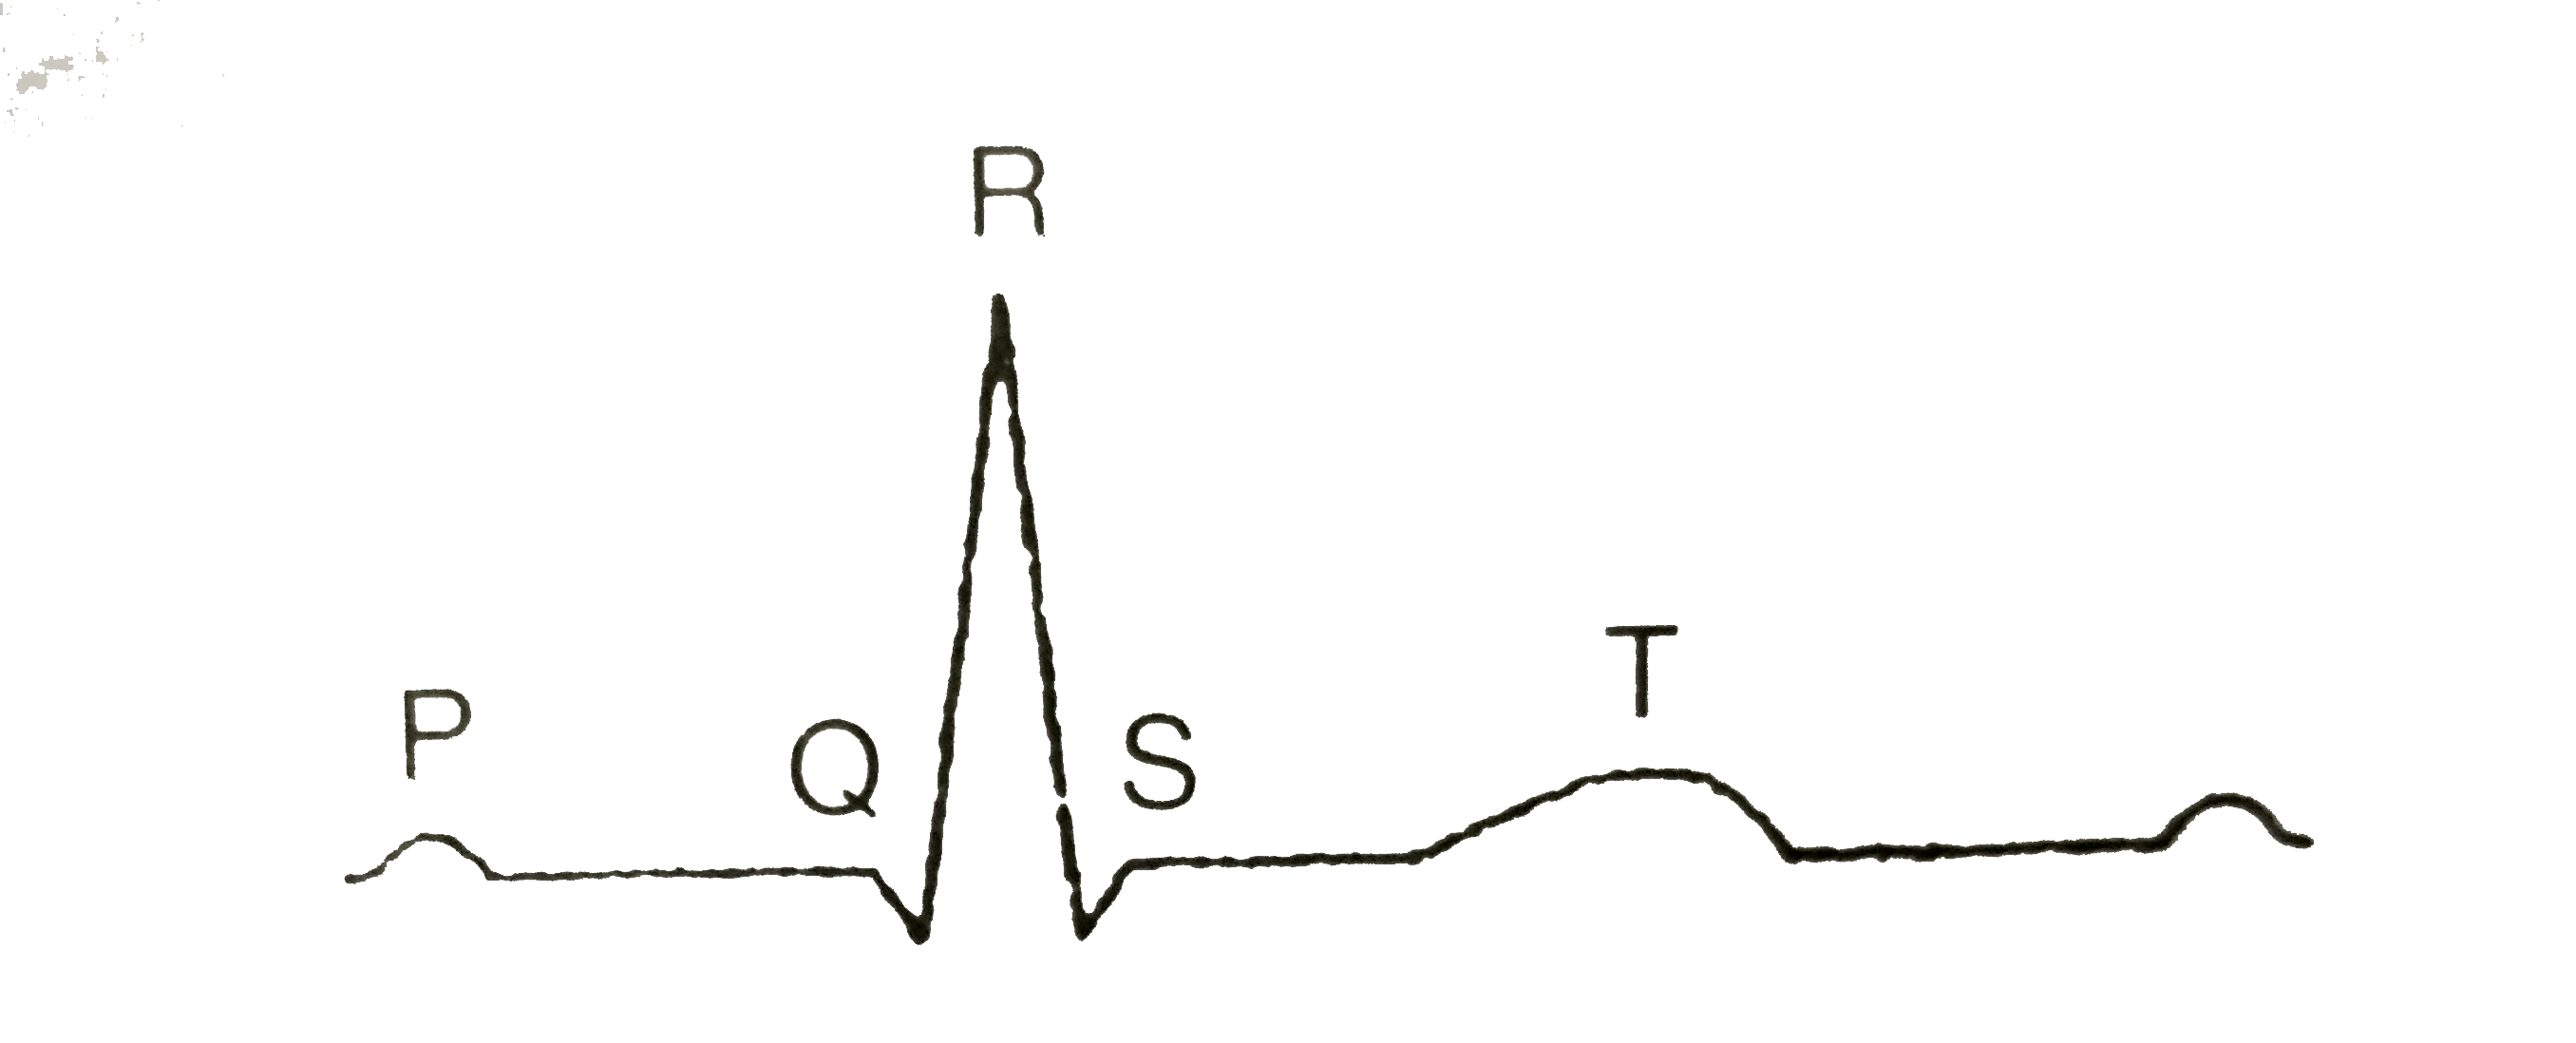
The end of T-wave in standard ECG of a normal person represents
Contraction of both the atria
End of ventricular systole
Beginning of the ventricular systole
Initiation of the atrial contraction
To solve the question regarding what the end of the T-wave in a standard ECG of a normal person represents, we can follow these steps:
1. Understand the Components of an ECG:
- An ECG (electrocardiogram) consists of several waves: P wave, QRS complex, and T wave. Each wave corresponds to specific electrical activities of the heart.
2. Identify the T Wave:
- The T wave specifically represents the repolarization of the ventricles. This is the phase where the heart muscle cells recover after contraction.
3. Analyze the Options:
- Option A: Contraction of both the atria - This is incorrect. The contraction of the atria is represented by the P wave.
- Option B: End of the ventricular systole - This is correct. The end of the T wave indicates that the ventricles have completed their contraction (systole) and are now repolarizing.
- Option C: Beginning of the ventricular systole - This is incorrect. The beginning of ventricular systole is represented by the QRS complex.
- Option D: Initiation of the arterial contraction - This is also incorrect. The initiation of arterial contraction is represented by the P wave.
4. Conclusion:
- Based on the analysis of the options, the correct answer is that the end of the T wave in a standard ECG of a normal person represents the end of ventricular systole.
Final Answer:
The end of the T-wave in the standard ECG of a normal person represents the end of ventricular systole.
---
- An ECG (electrocardiogram) consists of several waves: P wave, QRS complex, and T wave. Each wave corresponds to specific electrical activities of the heart.
- The T wave specifically represents the repolarization of the ventricles. This is the phase where the heart muscle cells recover after contraction.
- Option A: Contraction of both the atria - This is incorrect. The contraction of the atria is represented by the P wave.
- Option B: End of the ventricular systole - This is correct. The end of the T wave indicates that the ventricles have completed their contraction (systole) and are now repolarizing.
- Option C: Beginning of the ventricular systole - This is incorrect. The beginning of ventricular systole is represented by the QRS complex.
- Option D: Initiation of the arterial contraction - This is also incorrect. The initiation of arterial contraction is represented by the P wave.
- Based on the analysis of the options, the correct answer is that the end of the T wave in a standard ECG of a normal person represents the end of ventricular systole.
The end of the T-wave in the standard ECG of a normal person represents the end of ventricular systole.
Topper's Solved these Questions
Similar Questions
Knowledge Check
The diagram given here is the standard ECG of a normal person, the P-wave represents the
 AInitiatio of the ventricular contractionBBeginning of the systoleCEnd of systoleDContraction of both the atria
The diagram given here is the standard ECG of a normal person. The P-wave represents the
 AEnd of systoleBContraction of both the atriaCInitiation of the ventricular contractionDBeginning of the systole
the diagram given here is the standard ECG of a normal person. The P-wave represents the :
 AEnd of systoleBContraction of both the atriaCInitiation of the ventricular contractionDBeginning of the systole
The diagram given here is the standard ECG of a normal person, The P-wave represents the:

View SolutionIn the standard ECG of a normal person, the P-wave represents the
View SolutionThe end of the T-wave in ECG mark the
View SolutionThe end of T-wave marks the end of
View SolutionT wave on an ECG represents-
View Solution


