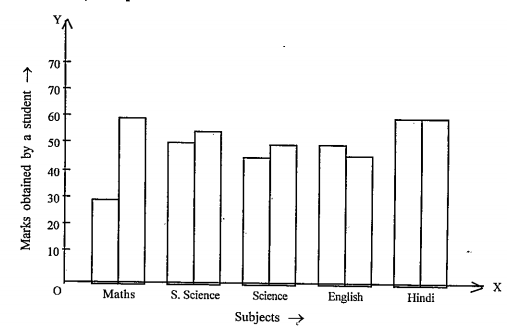
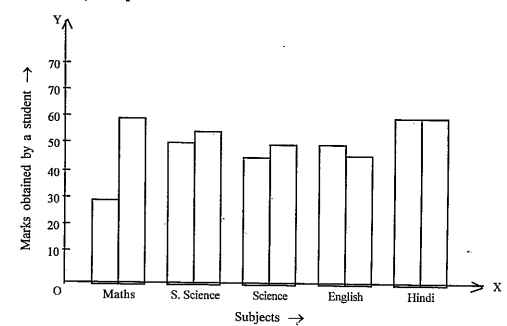
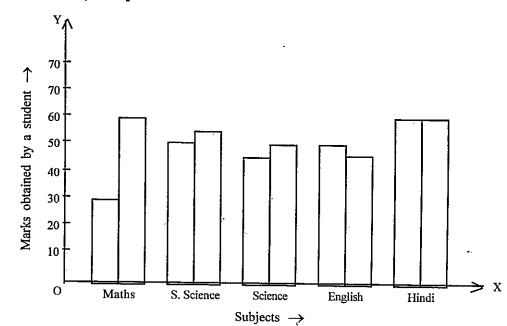
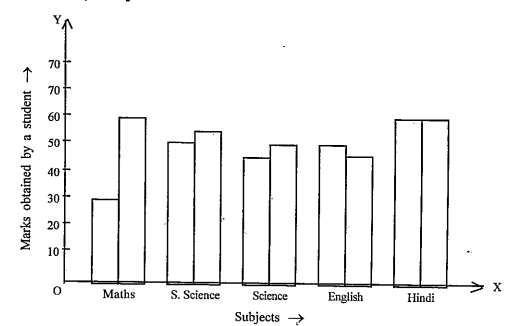
Double Bar Graph : A bar graph showing two sets of data simultaneously. It useful for the comparison of the data.

In which subject has the performance improved the most?Solution in Assamese
Step by step video & image solution for Double Bar Graph : A bar graph showing two sets of data simultaneously. It useful for the comparison of the data. In which subject has the performance improved the most? by Maths experts to help you in doubts & scoring excellent marks in Class 8 exams.
Updated on:21/07/2023Topper's Solved these Questions
Similar Questions
Which of the following numbers are not perfect cubes?
216
View SolutionFollowing are the car parking charges near railway station upto

Check if the parking charges are in direct proportion to the parking tiime.
View SolutionWhich of the following are correct chain isomers of butane ? (i)
View SolutionDetermine the point of symmetry of a regular hexagon.
View SolutionMatch the following Column A to Column B

View SolutionMatch the following Column A to Column B

View SolutionMatch the following Column A to Column B

View SolutionThe inequation represented by the graph given below is :
View SolutionThe inequation that best describes the graph given below is _________
View SolutionThe inequation that best describes the following graph is _________
View SolutionIn the given figure, PQRS is a parallelogram. A and B are the mid-point of ¯¯¯¯¯¯PQ and ¯¯¯¯¯SR respectively. If PS=BR, then the quadrilateral ADBC is a…………………… ,
ltimg src="https://d10lpgp6xz60nq.cloudfront.net/physics_images/PS_MATH_IX_C12_E05_020_Q01.png" width="80%"gt
View SolutionDouble Bar Graph : A bar graph showing two sets of data simultaneously. It useful for the comparison of the data.

What is the information given by the double bar graph?
View SolutionDouble Bar Graph : A bar graph showing two sets of data simultaneously. It useful for the comparison of the data.

In which subject has the performance deteriorated?
View SolutionDouble Bar Graph : A bar graph showing two sets of data simultaneously. It useful for the comparison of the data.

In which subject is the performance at par?
View SolutionDouble bar graph : Bar graph showing two groups of data together In which subject has the student's performance improved the most?
View SolutionDouble bar graph : Bar graph showing two groups of data together In which subject has the performance declined?
View Solution
