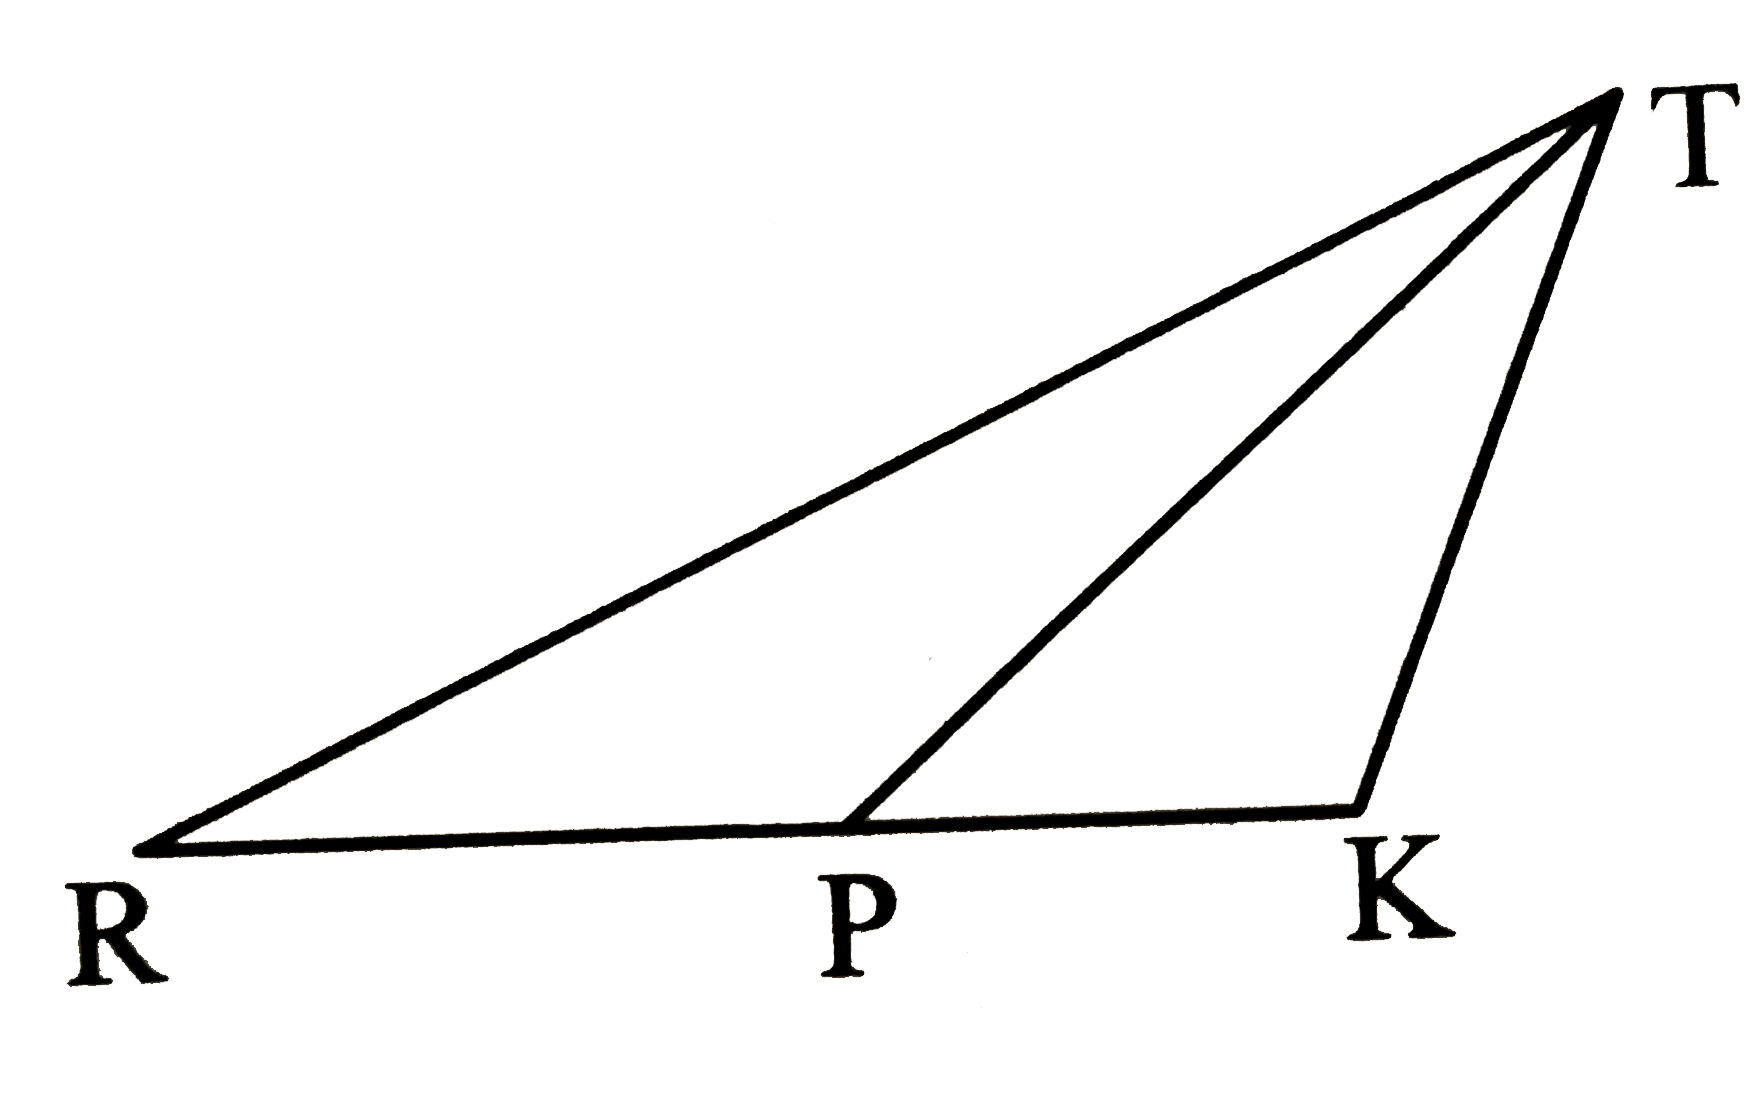
In the figure, RP : PK = 11 : 8, then =
 Solution in Marathi
(a)
(b)
(c)
(d)
The correct Answer is:A
Step by step video & image solution for In the figure, RP : PK = 11 : 8, then (A(DeltaTRP))/(A(DeltaTPK))= by Maths experts to help you in doubts & scoring excellent marks in Class 10 exams.
Updated on:21/07/2023Topper's Solved these Questions
- SIMILARITY BOOK - TARGET PUBLICATIONCHAPTER - SIMILARITY EXERCISE - Additonal Problems for Practice( Basid on Practice Set 1.1)
11 Videos
- SIMILARITY BOOK - TARGET PUBLICATIONCHAPTER - SIMILARITY EXERCISE - Additonal Problems for Practice(Based on Practice Set 1.2)
11 Videos
- SIMILARITY BOOK - TARGET PUBLICATIONCHAPTER - SIMILARITY EXERCISE - Activites for Practice
4 Videos
- QUESTION FROM STD. IXBOOK - TARGET PUBLICATIONCHAPTER - QUESTION FROM STD. IXEXERCISE - Statistics
11 Videos
- STATISTICSBOOK - TARGET PUBLICATIONCHAPTER - STATISTICSEXERCISE - Problem Set-6
5 Videos
Similar Questions
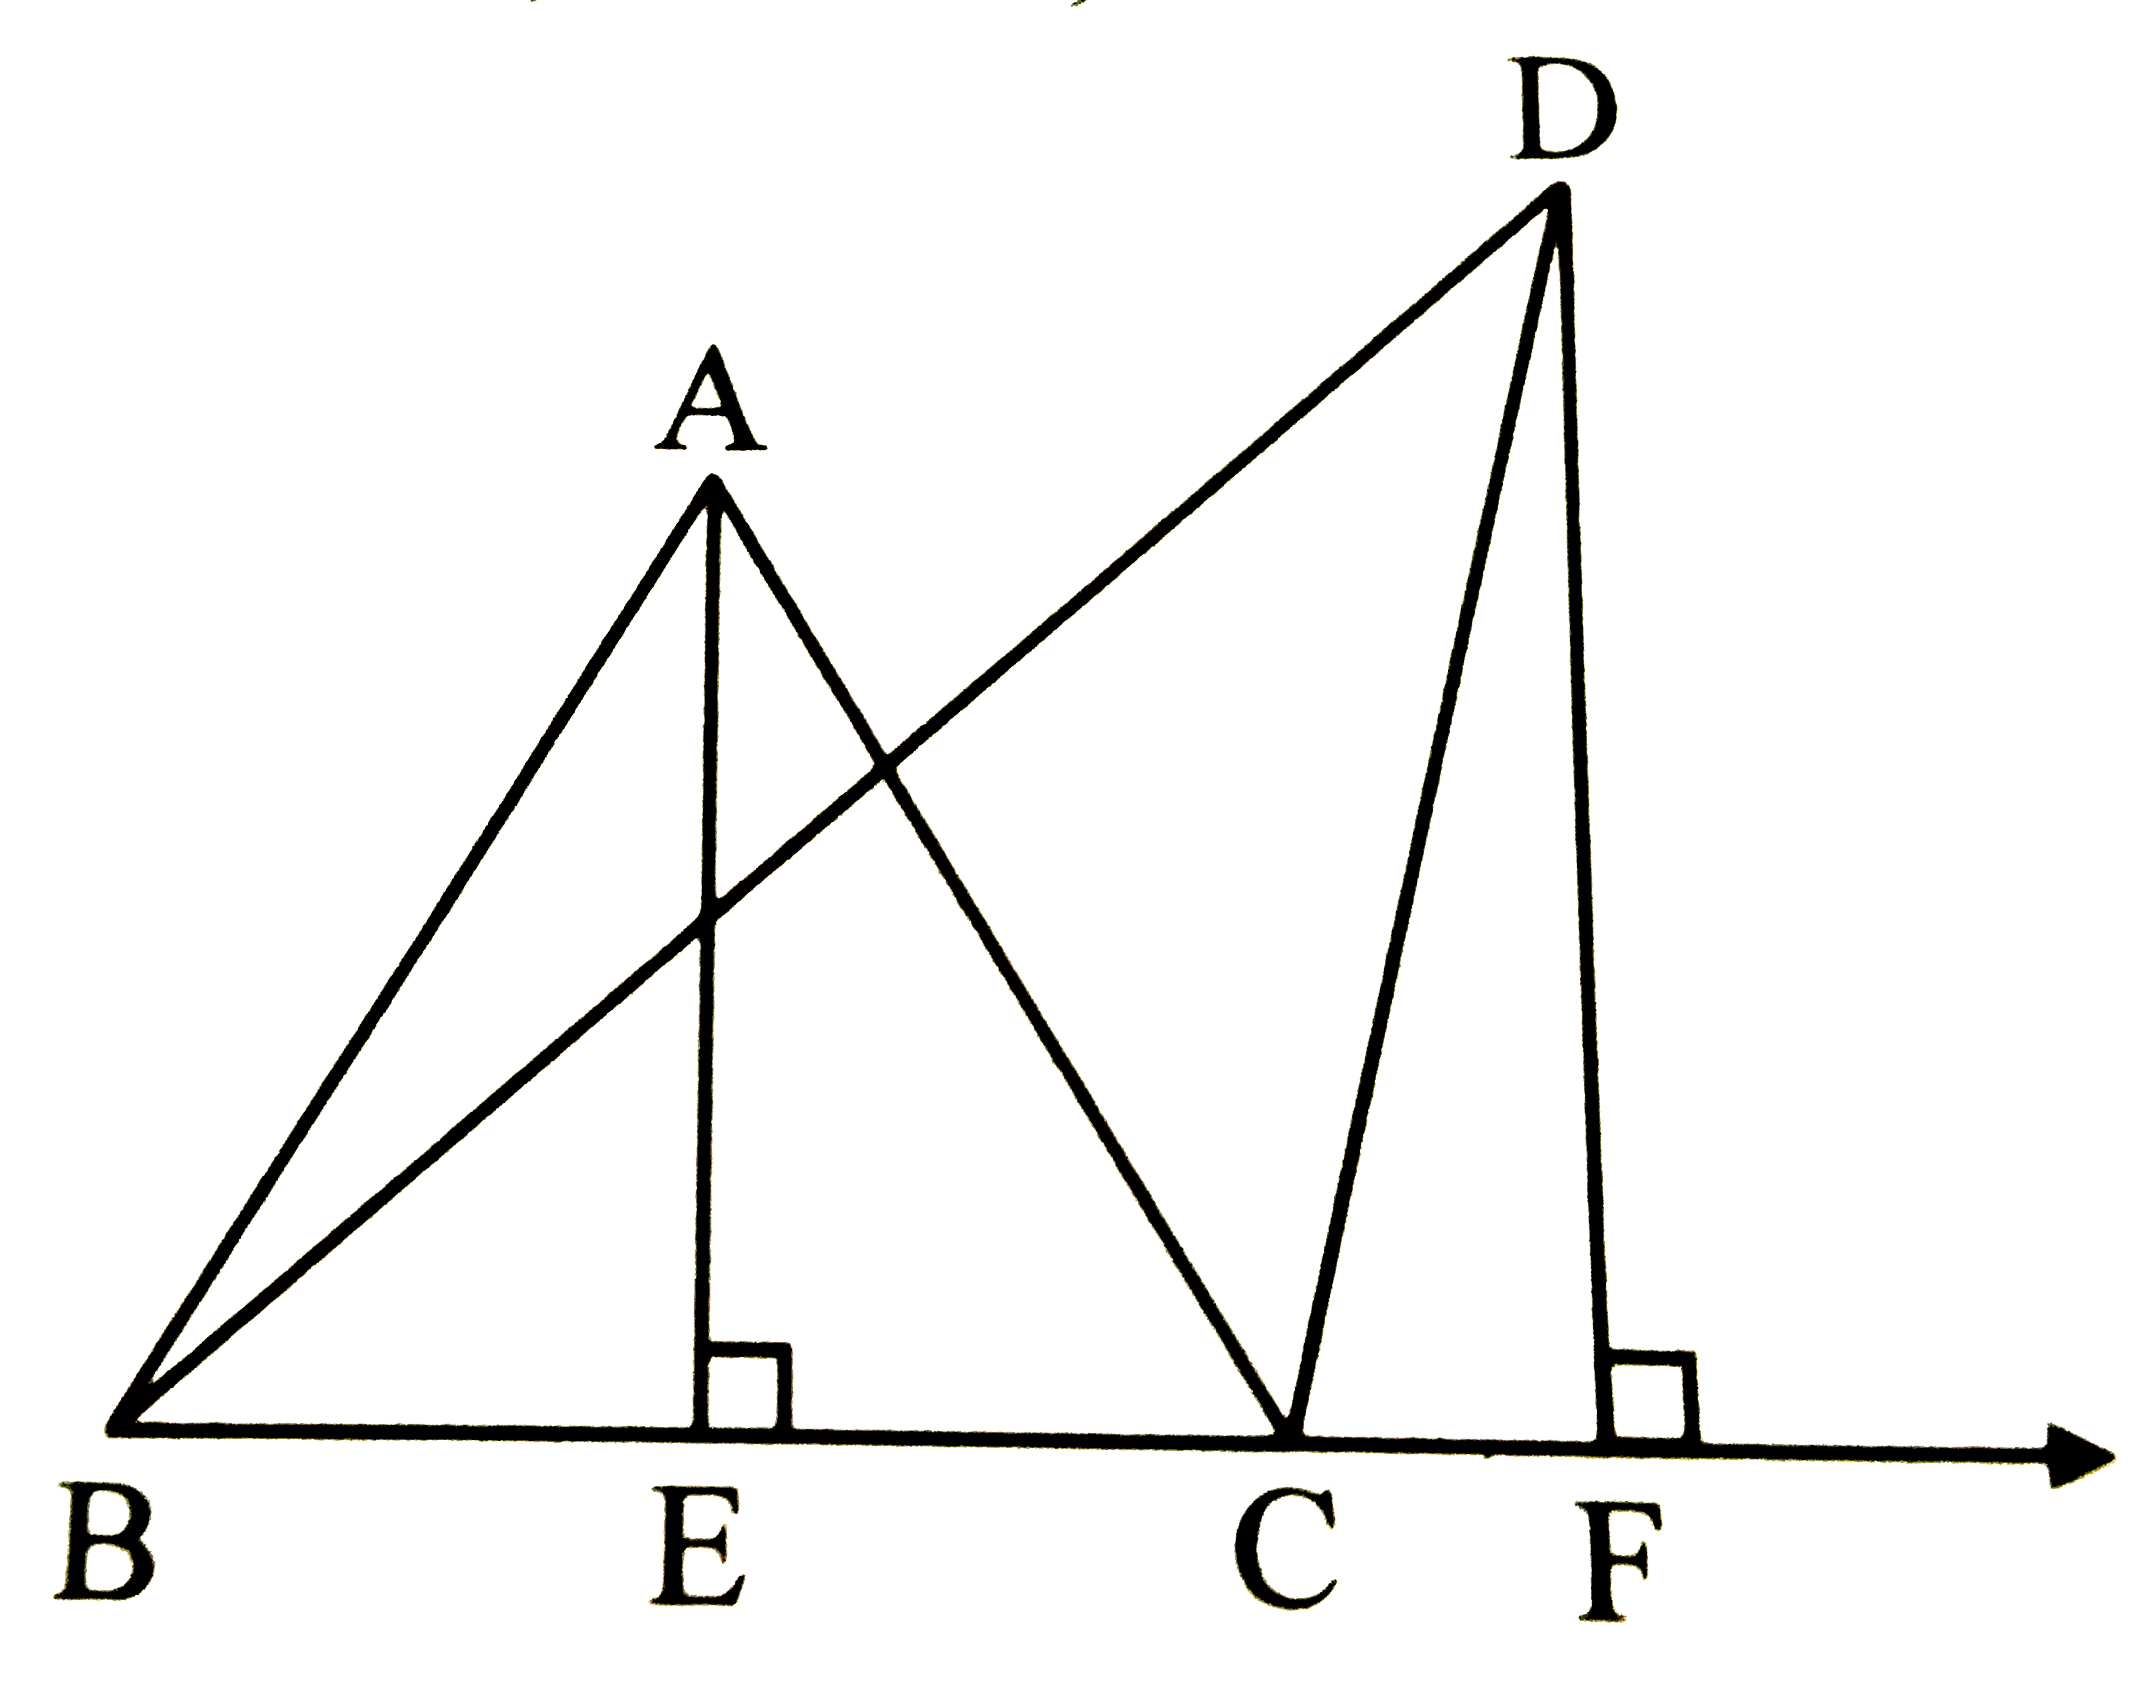
In given figure, seg AE ⊥ seg BC, seg DF ⊥ line BC,
AE = 4, DF = 6, then find A(ΔABC)A(ΔDBC).

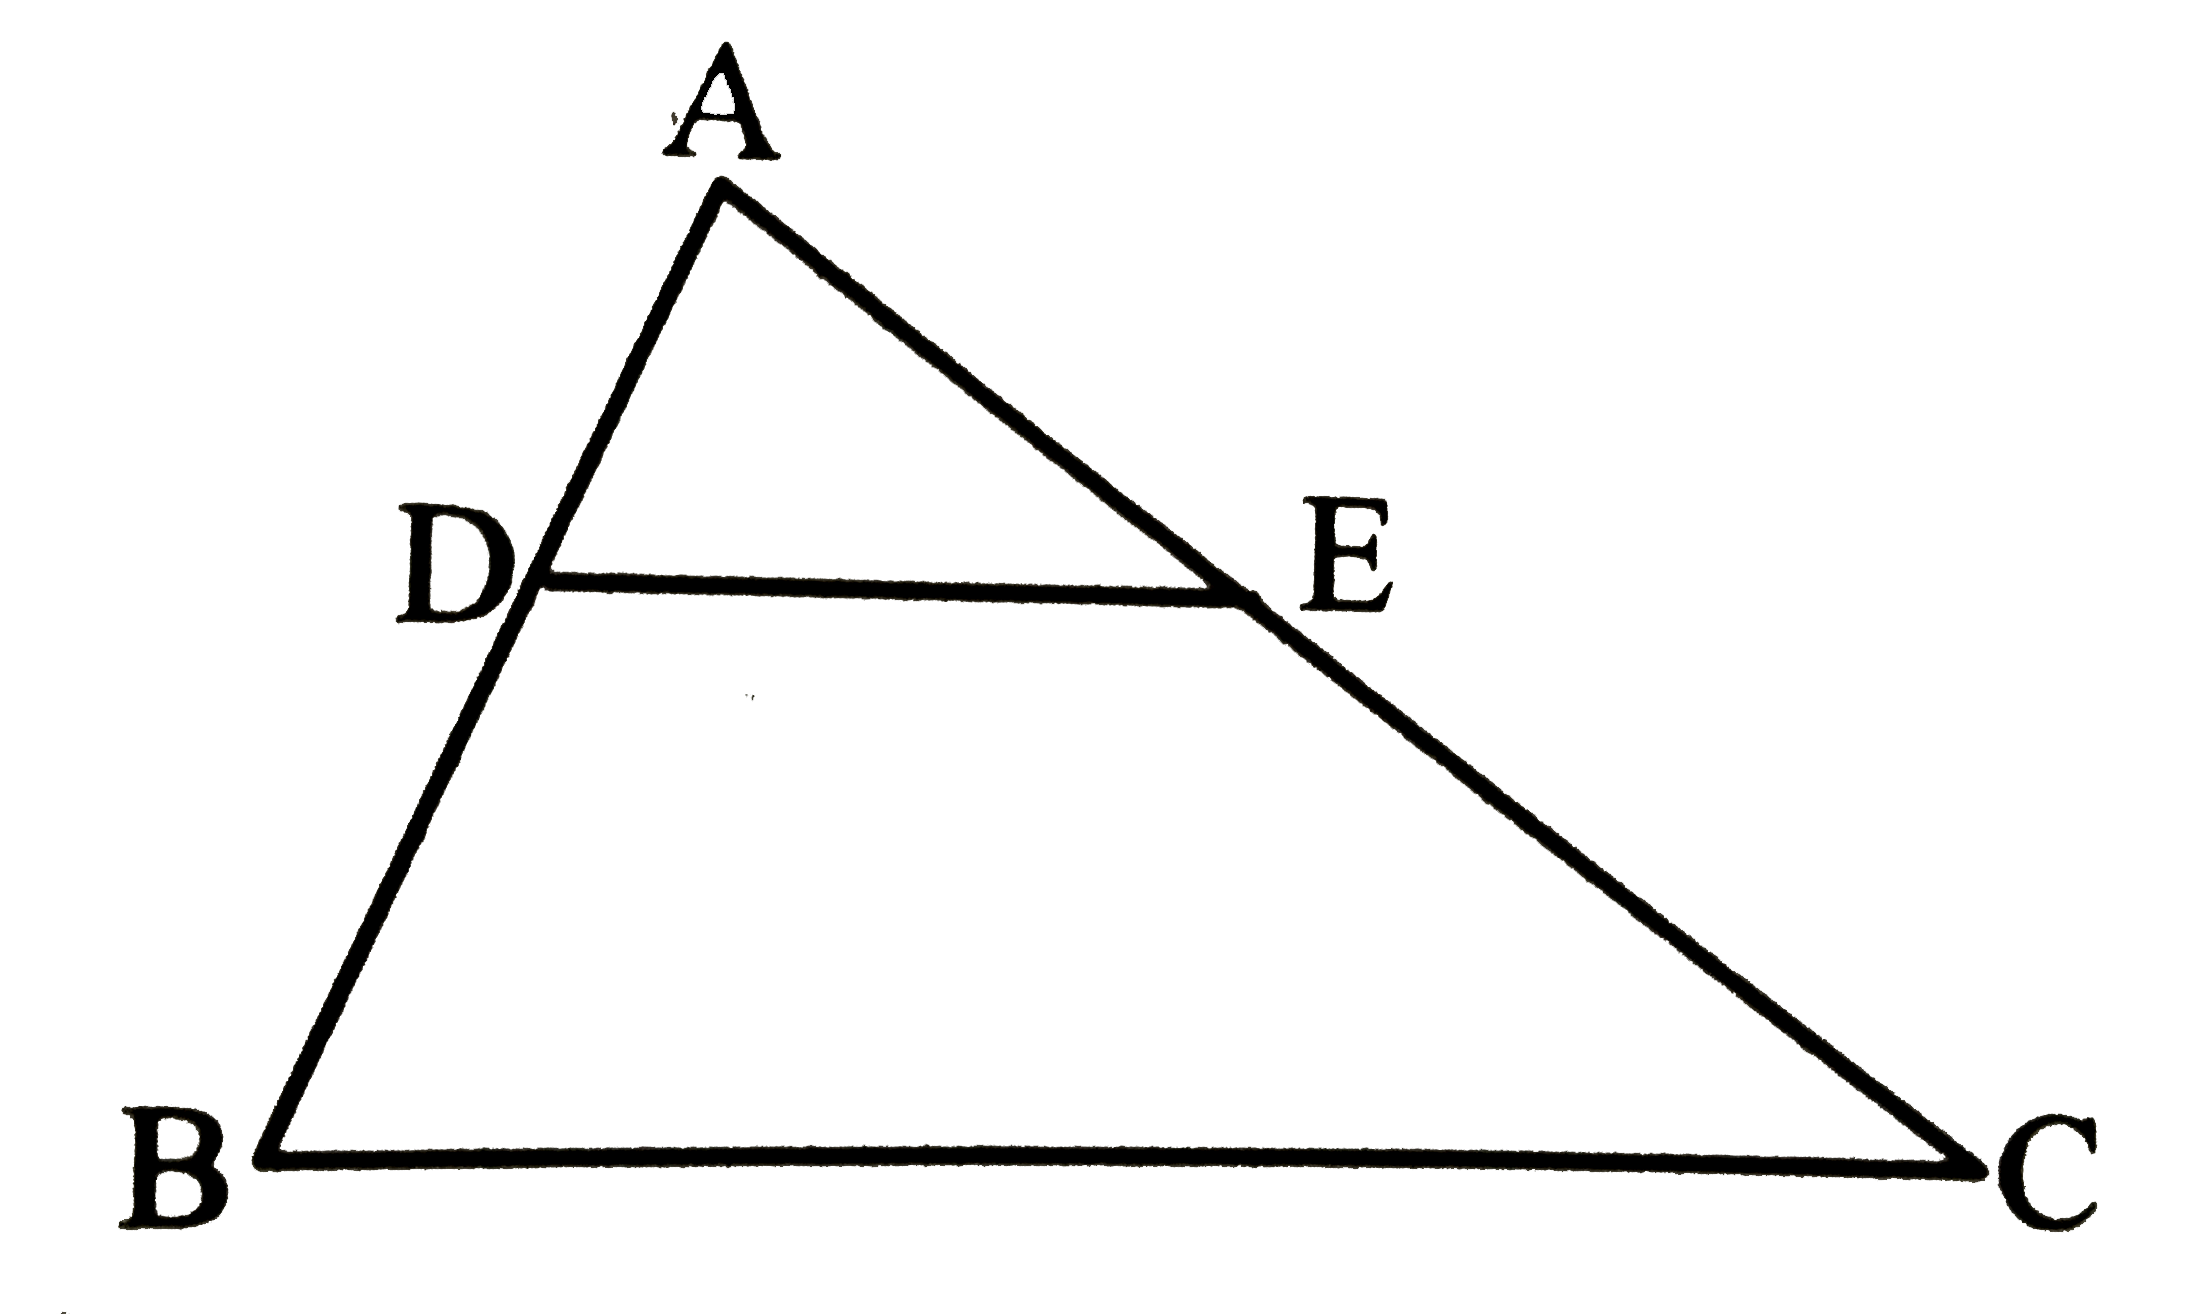
View SolutionIn ΔABC, DE||BC. If DB = 5.4 cm, AD = 1.8 cm, EC = 7.2 cm,
then find AE.

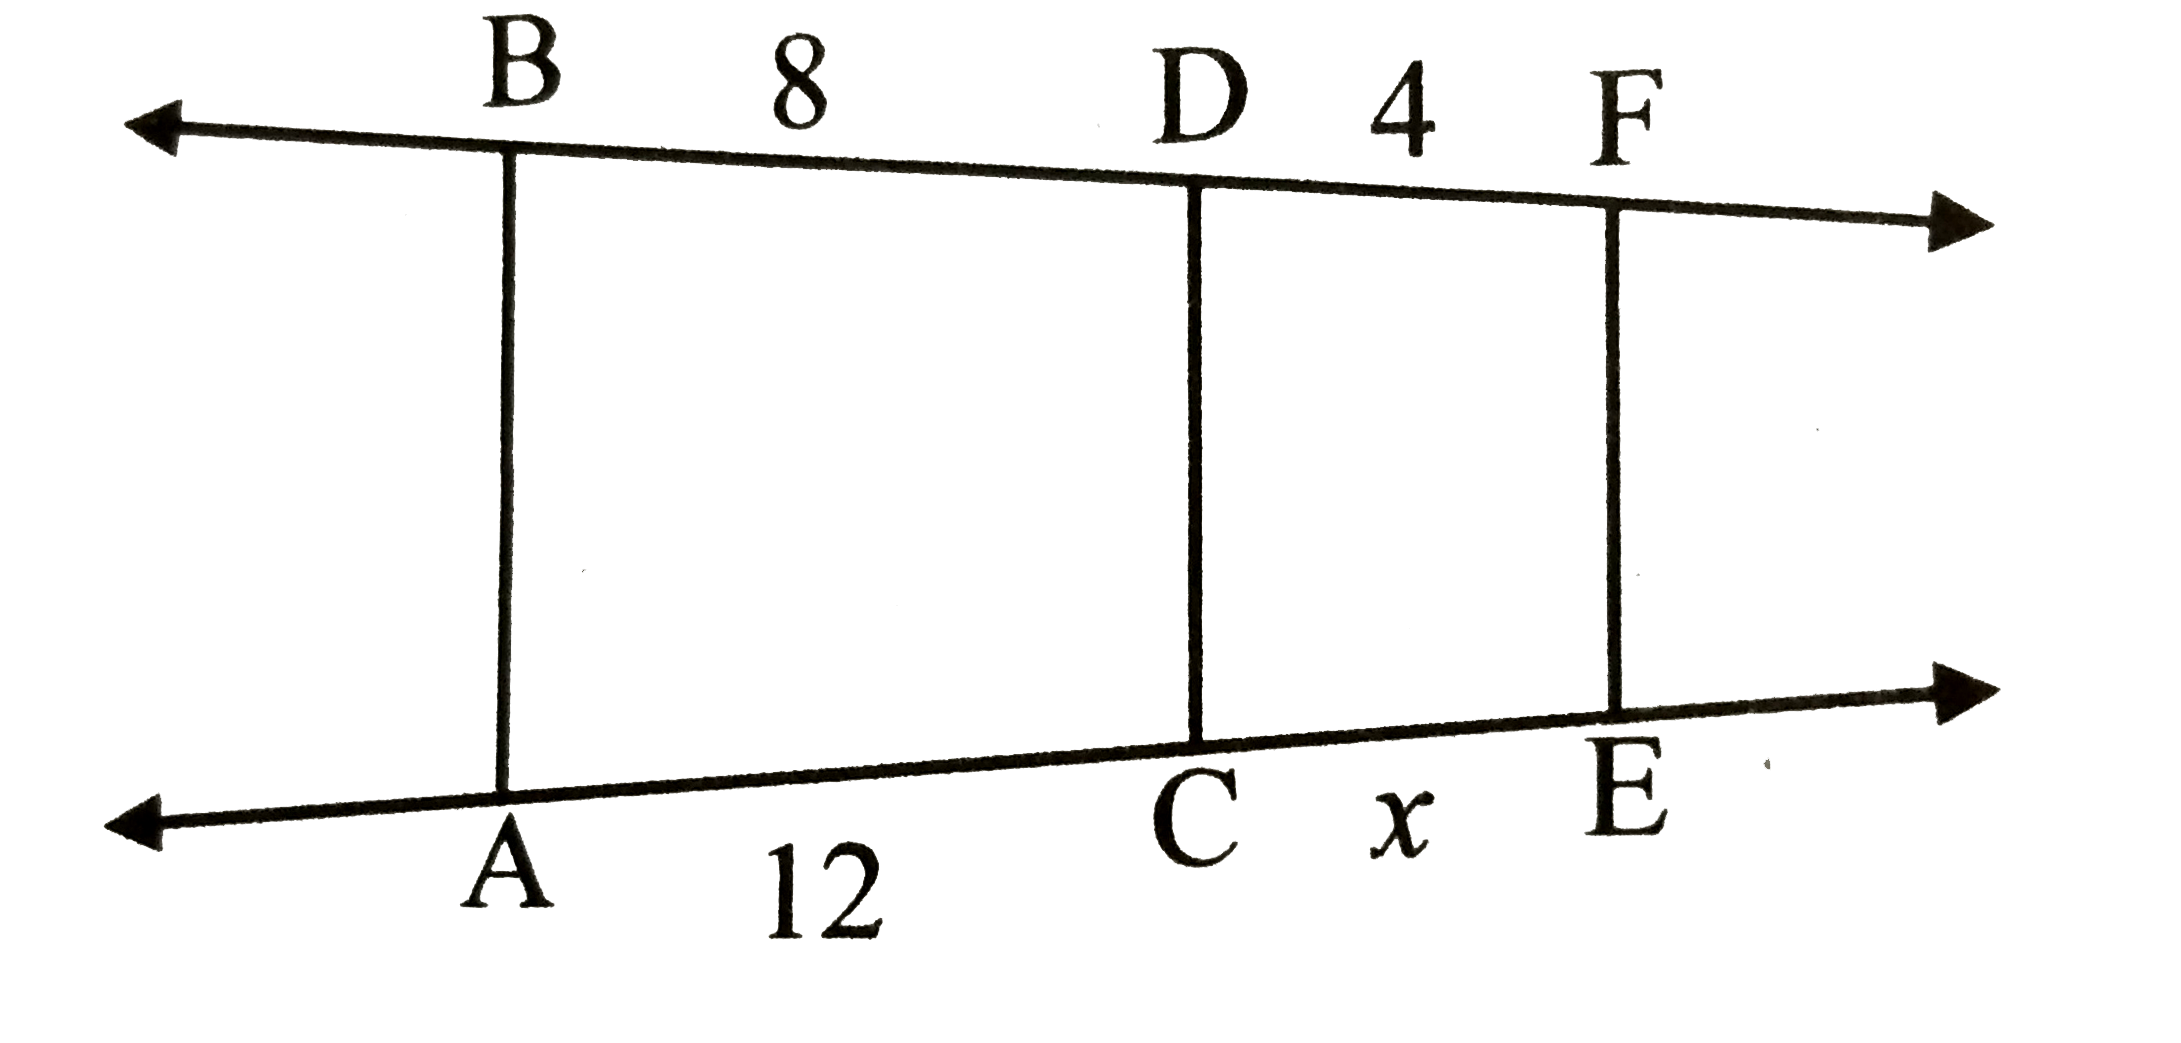
View SolutionIn the adjoining figure, if AB||CD||FE, then find x and AE.

View SolutionClassify the following information as primary or secondary data.
For a school project, literacy percentage of give villages gathered by a student from the internet.
View SolutionDifferent expenditures incurred on the construction of a building were shown by a pie diagram. The expenditure of Rs45000 on current was shown by a sector of central angle of 75∘. What was the total expenditure of the construction?
View SolutionHow many lines of symmetry does the above figure have ?
View SolutionDetermine the point of symmetry of a regular hexagon.
View SolutionDtermine the images of the following figure about the given line :
View SolutionMatch the following Column A to Column B

View SolutionMatch the following Column A to Column B

View SolutionMatch the following Column A to Column B

View SolutionFind the area of the figure given below.

View SolutionThe area of the shaded part in the figure given below is ______.

View SolutionThe inequation represented by the graph given below is :
View SolutionThe inequation that best describes the graph given below is _________
View SolutionThe inequation that best describes the following graph is _________
View Solution
