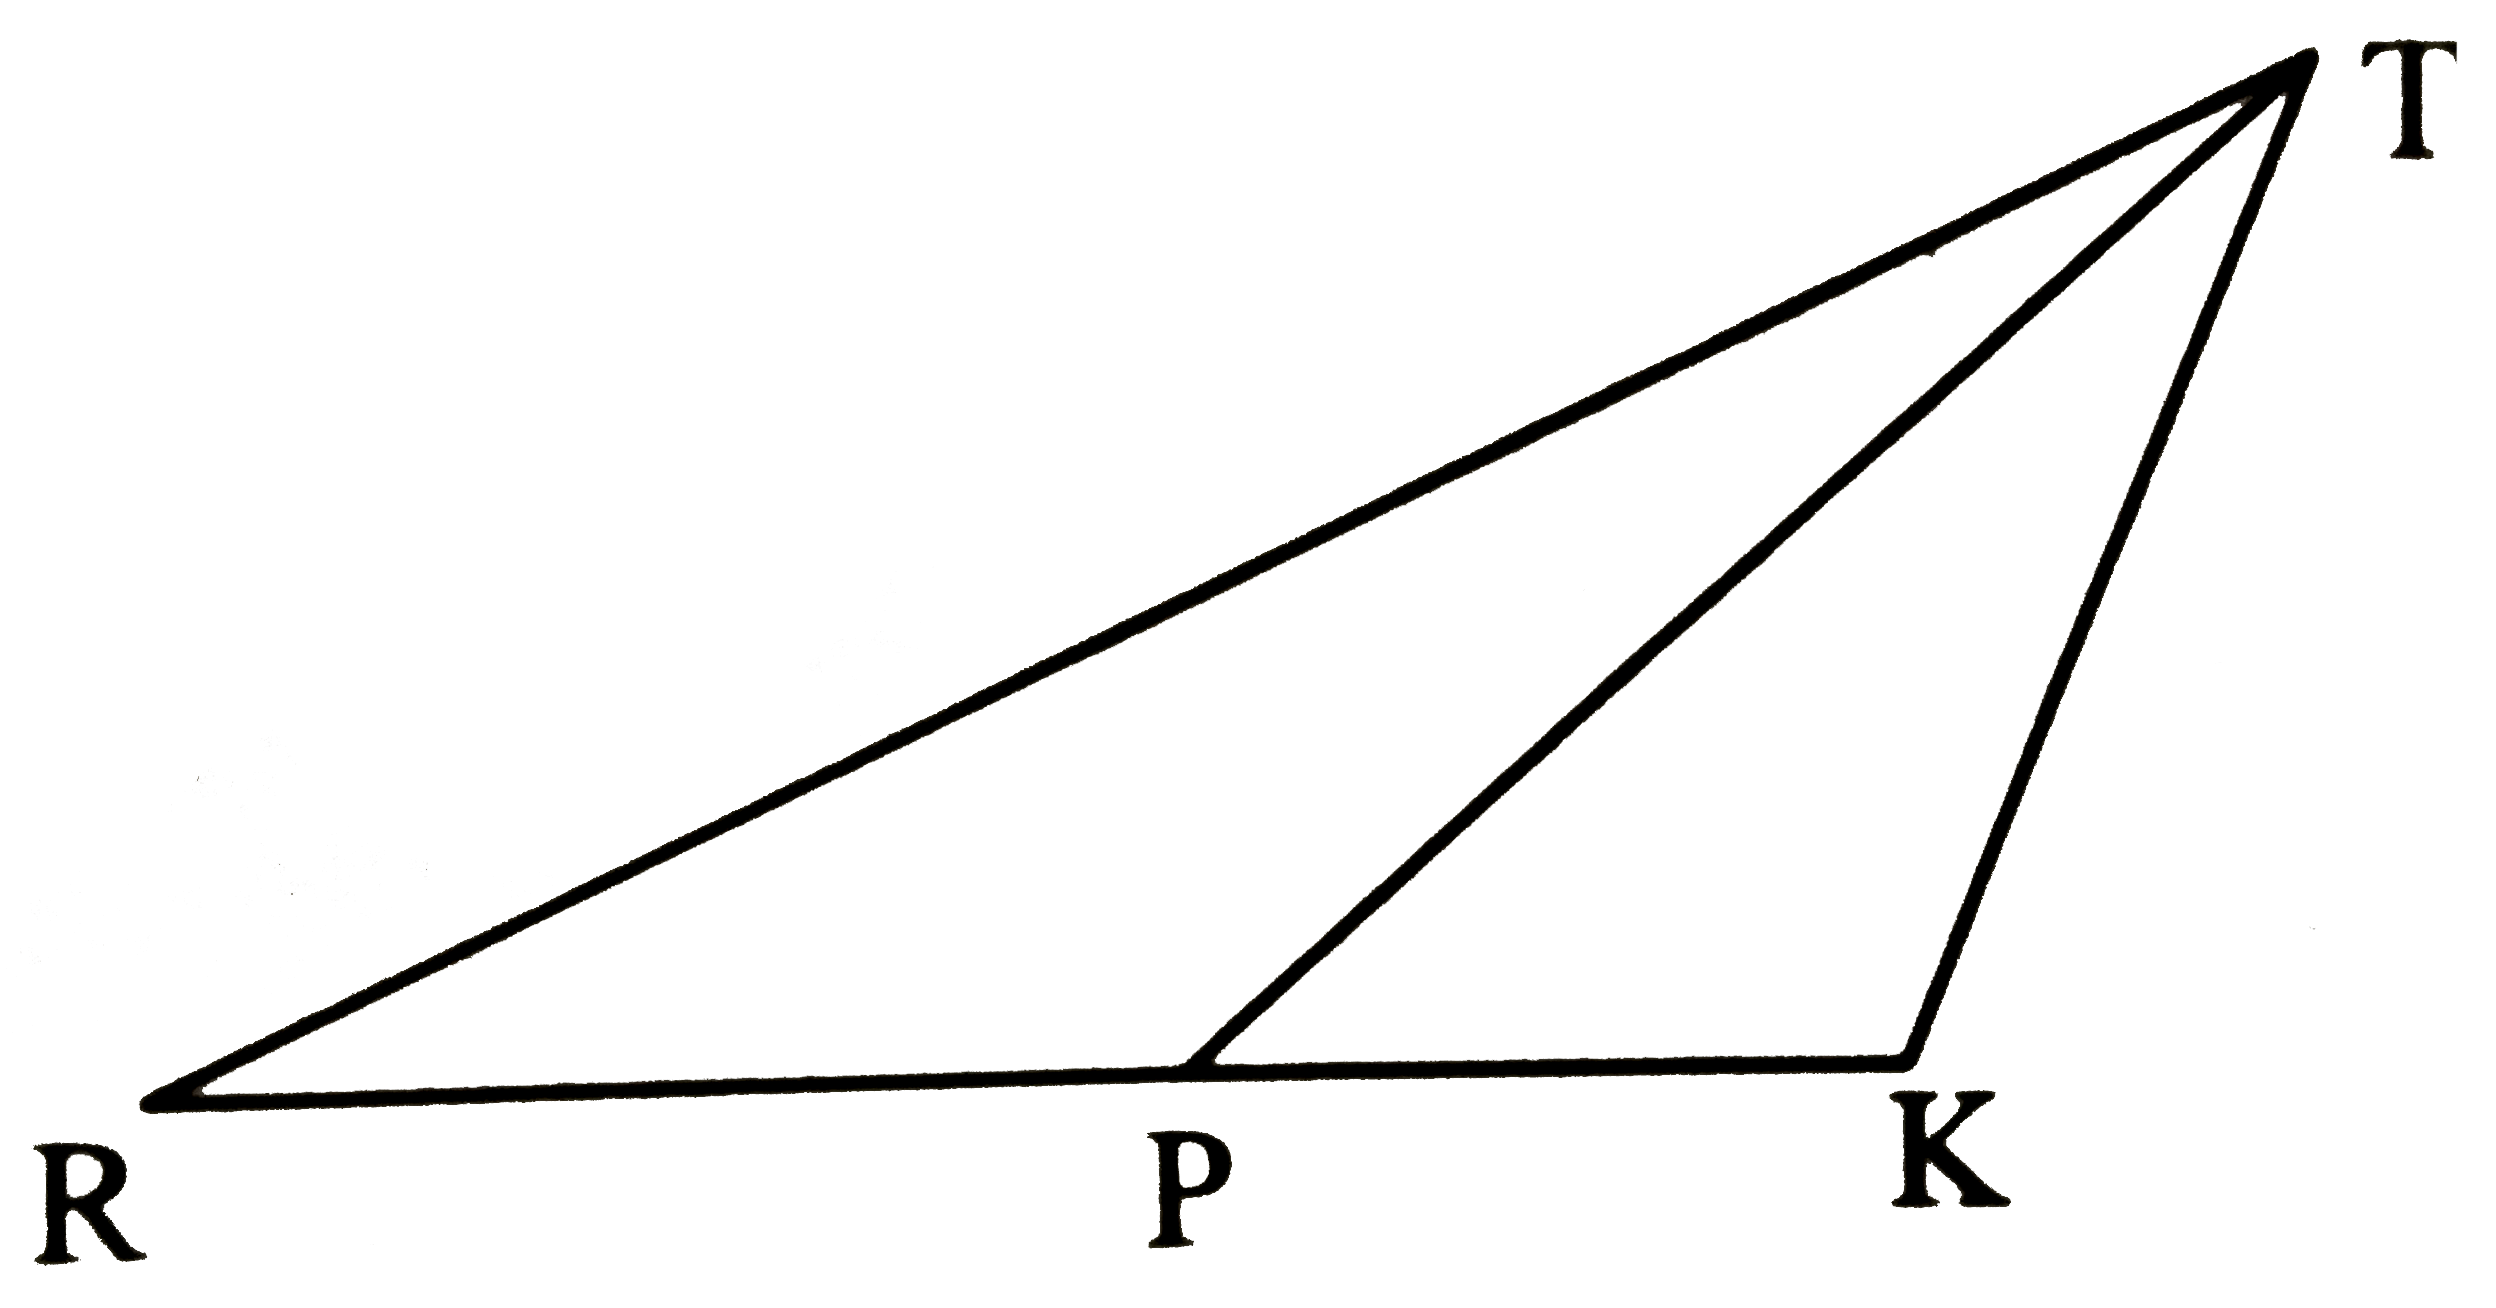
In the given figure, if RP : PK = 3: 2, then find the following ratios.
(i)
(ii)
(iii)
 Solution in Marathi
The correct Answer is:3 : 2 ii. 5 : 2 iii. 3 : 5
Step by step video & image solution for In the given figure, if RP : PK = 3: 2, then find the following ratios. (i) A(DeltaTRP):A(DeltaTPK) (ii) A(DeltaTRK):A(DeltaTPK) (iii) A(DeltaTRP):A(DeltaTRK) by Maths experts to help you in doubts & scoring excellent marks in Class 10 exams.
Updated on:21/07/2023Topper's Solved these Questions
- SIMILARITY BOOK - TARGET PUBLICATIONCHAPTER - SIMILARITY EXERCISE - Additonal Problems for Practice(Based on Practice Set 1.2)
11 Videos
- SIMILARITY BOOK - TARGET PUBLICATIONCHAPTER - SIMILARITY EXERCISE - Additonal Problems for Practice(Based on Practice Set 1.3)
7 Videos
- SIMILARITY BOOK - TARGET PUBLICATIONCHAPTER - SIMILARITY EXERCISE - Multiple Choice Questions
28 Videos
- QUESTION FROM STD. IXBOOK - TARGET PUBLICATIONCHAPTER - QUESTION FROM STD. IXEXERCISE - Statistics
11 Videos
- STATISTICSBOOK - TARGET PUBLICATIONCHAPTER - STATISTICSEXERCISE - Problem Set-6
5 Videos
Similar Questions
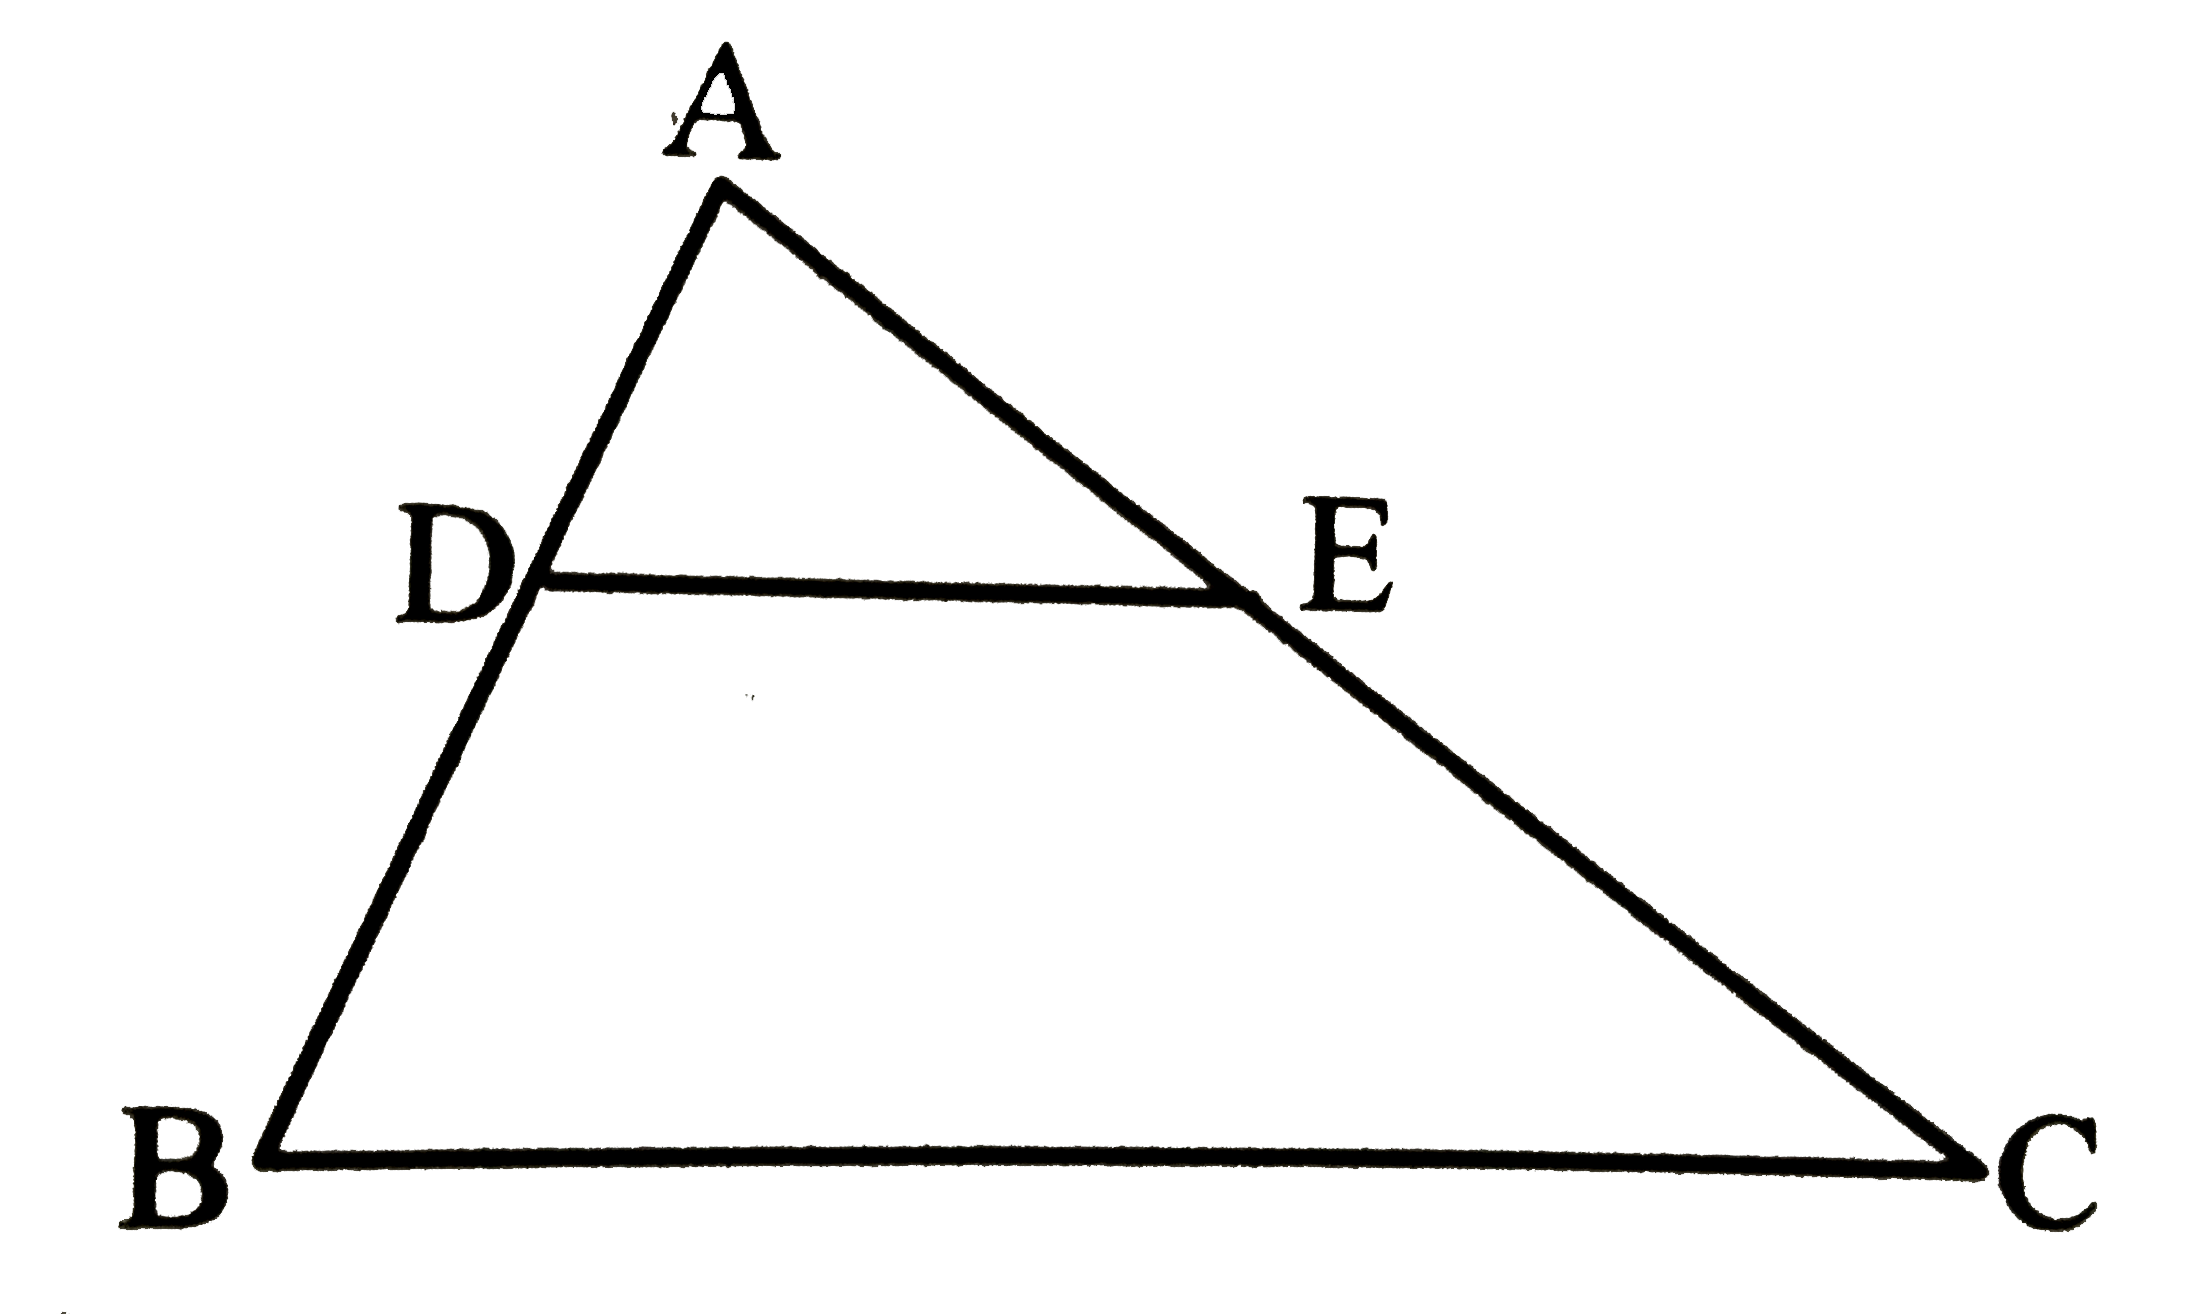
In ΔABC, DE||BC. If DB = 5.4 cm, AD = 1.8 cm, EC = 7.2 cm,
then find AE.

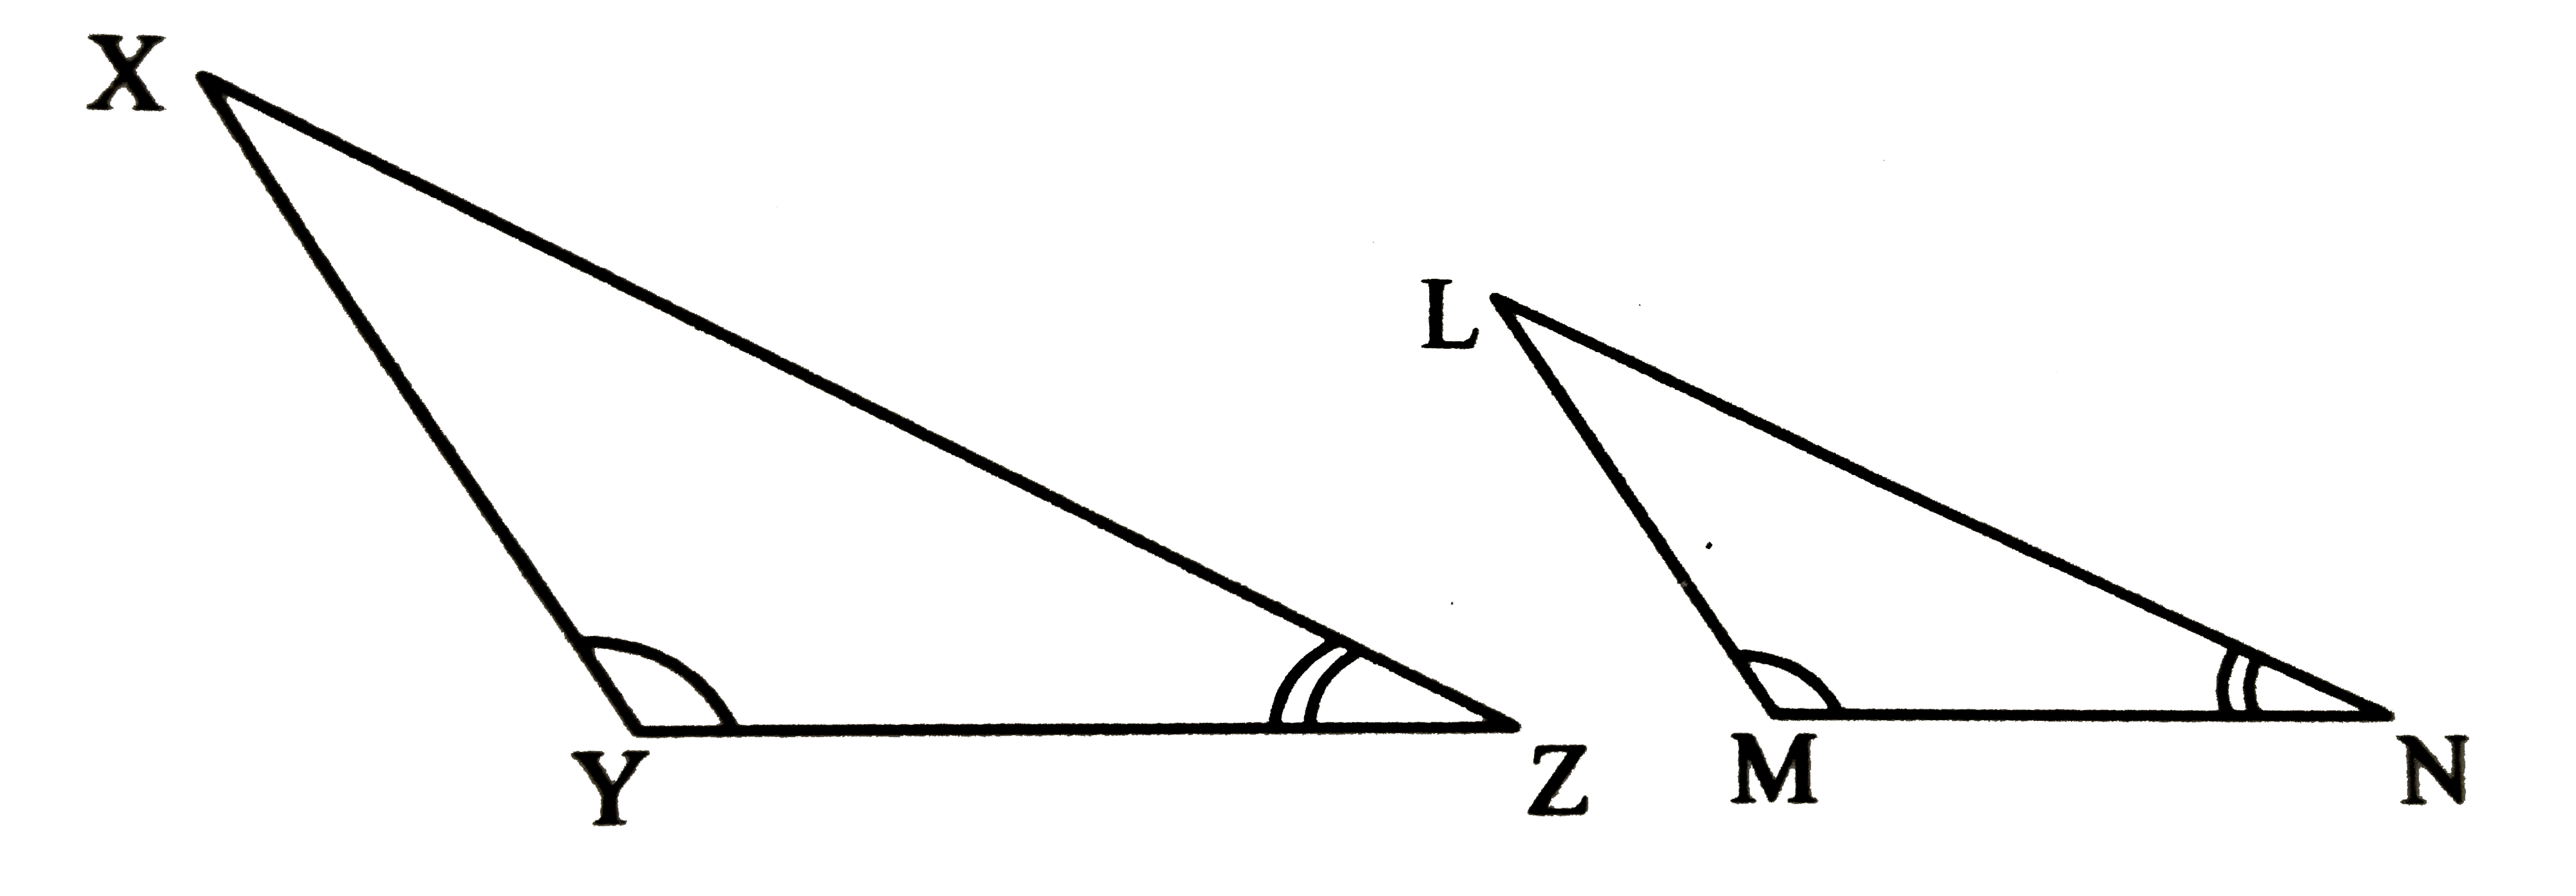
View SolutionIn ΔXYZ,∠Y=100∘,∠Z=30∘. In ΔLMN,∠M=100∘,∠N=30∘. Are ΔXYZ and ΔLMNsimilar? If yes, by which test?

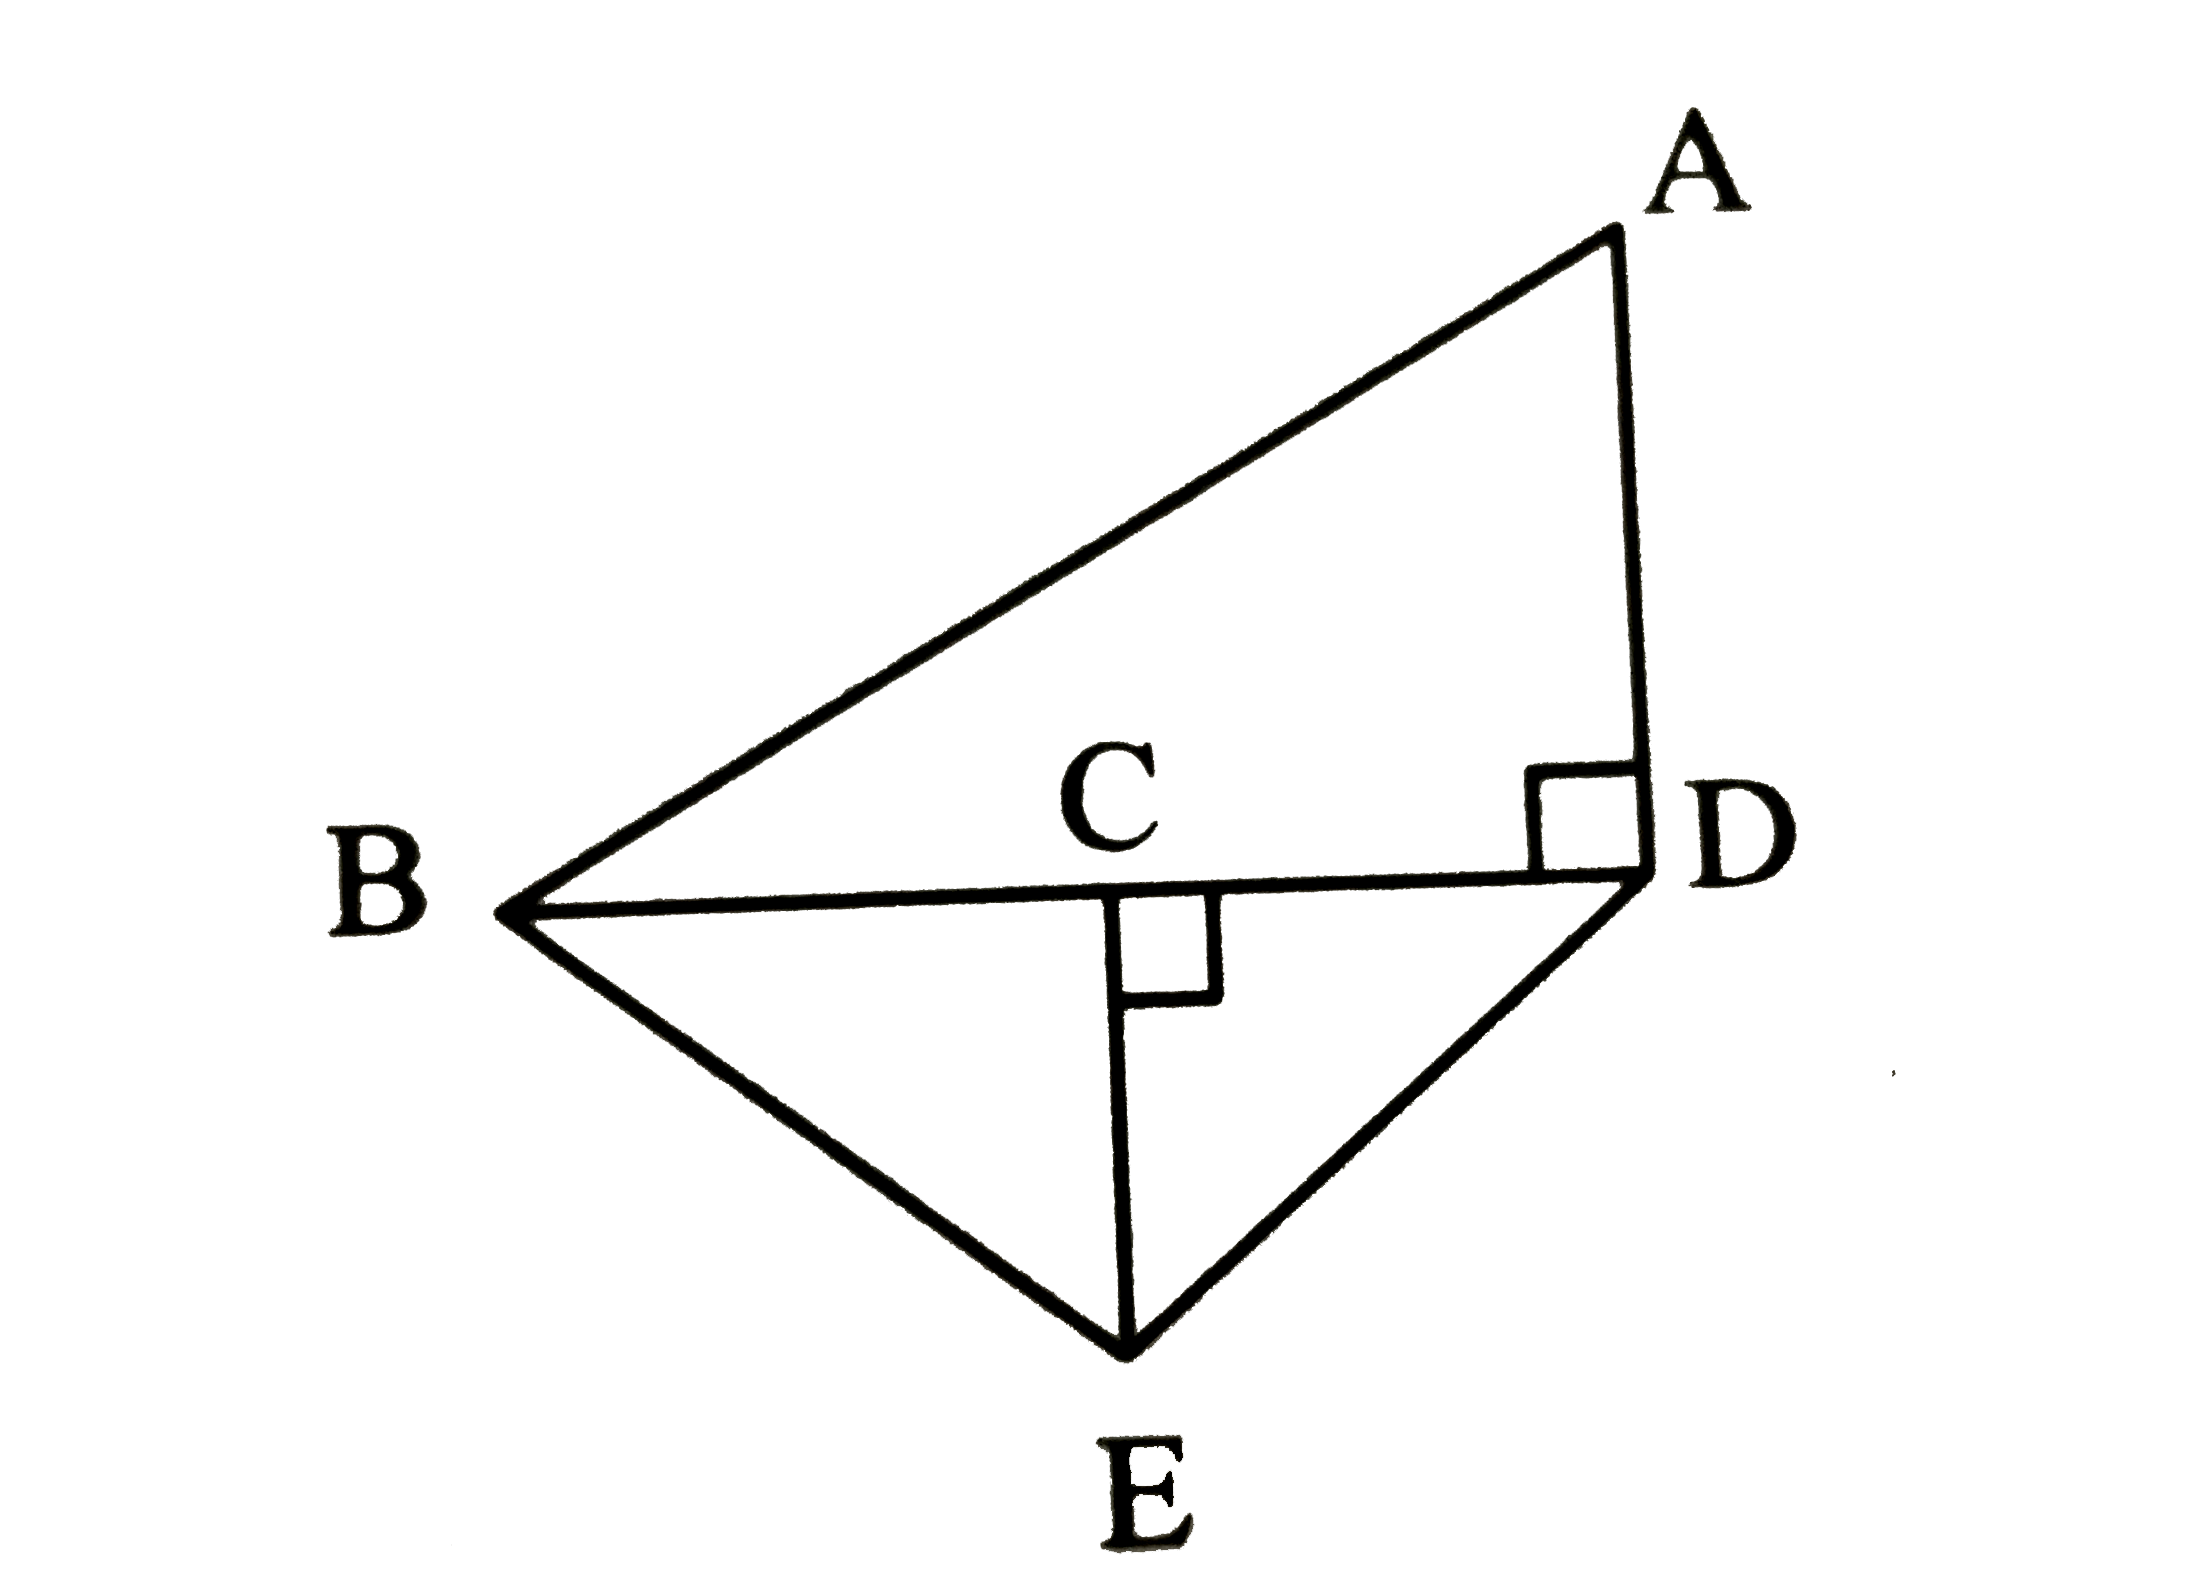
View SolutionIn the given figure, if AD = 5 cm and CE = 3 , then
A(ΔABD)A(ΔBED)= __________.

View SolutionClassify the following information as primary or secondary data.
For a school project, literacy percentage of give villages gathered by a student from the internet.
View SolutionDifferent expenditures incurred on the construction of a building were shown by a pie diagram. The expenditure of Rs45000 on current was shown by a sector of central angle of 75∘. What was the total expenditure of the construction?
View SolutionDetermine the point of symmetry of a regular hexagon.
View SolutionDtermine the images of the following figure about the given line :
View SolutionMatch the following Column A to Column B

View SolutionMatch the following Column A to Column B

View SolutionMatch the following Column A to Column B

View SolutionFind the area of figure given below.

View SolutionFind the perimeter of the figure given below.

View SolutionFind the area of the figure given below.

View SolutionThe inequation represented by the graph given below is :
View SolutionThe inequation that best describes the graph given below is _________
View SolutionThe inequation that best describes the following graph is _________
View Solution
