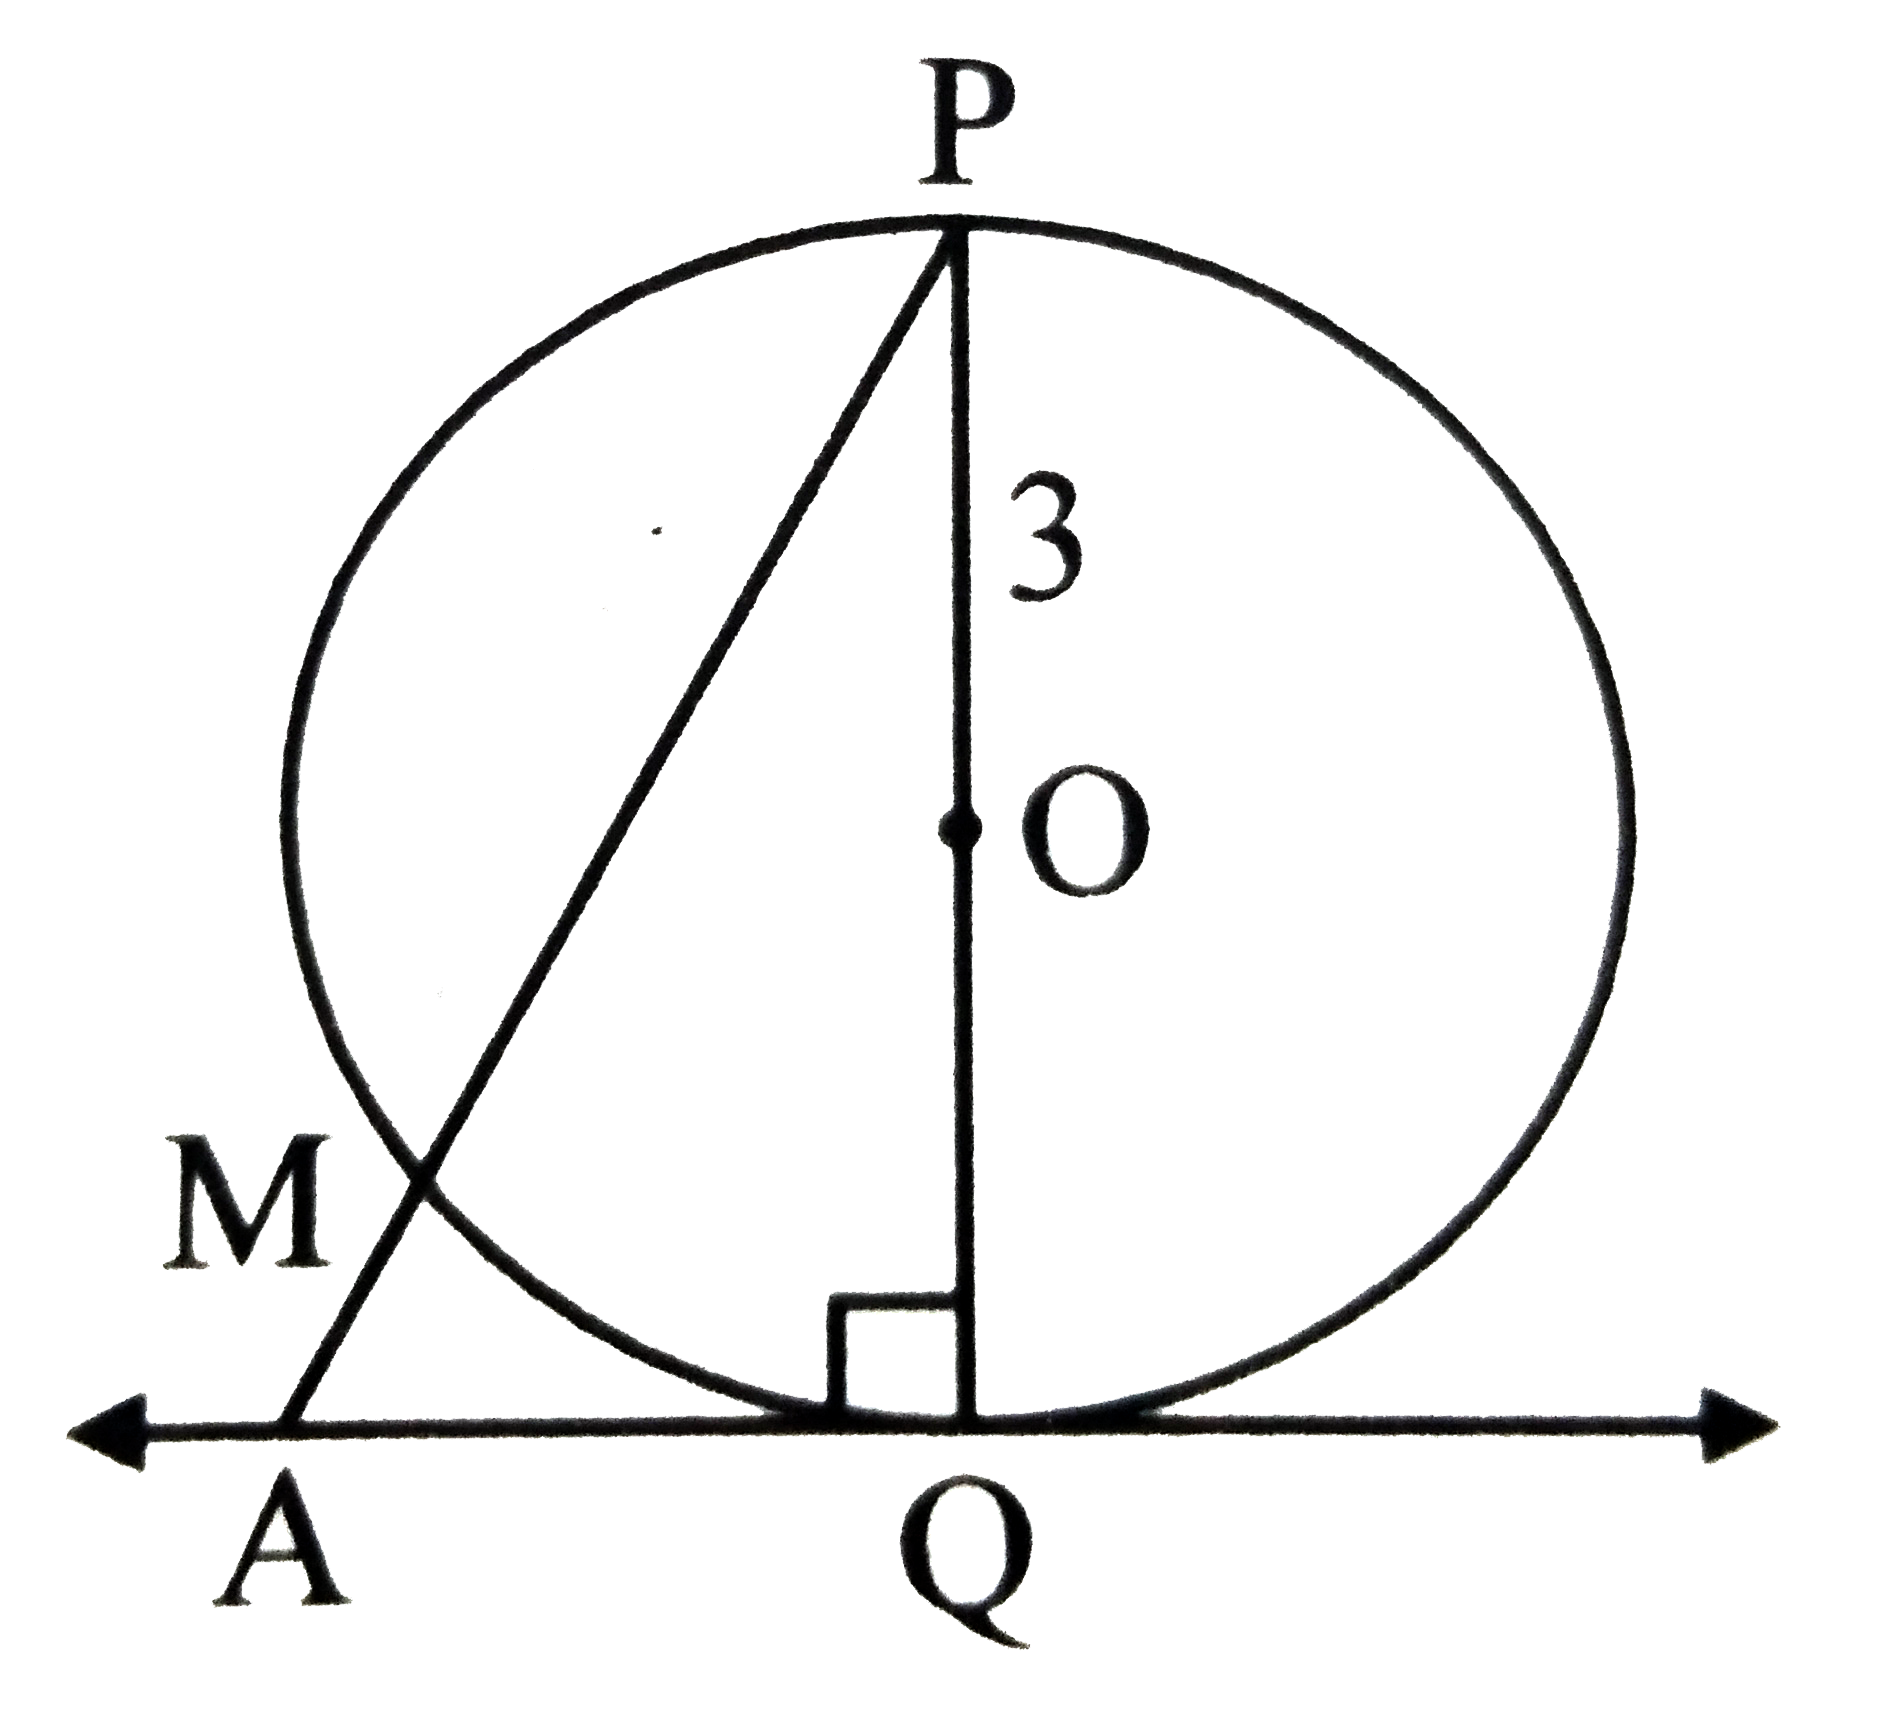
In the adjoining figure, O is the centre, seg PQ is diameter,
line AQ is a tangent. If OP=3 and m(arc PM)=120∘,
determine AP.
 Solution in Marathi
The correct Answer is:4√3 units
Step by step video & image solution for In the adjoining figure, O is the centre, seg PQ is diameter, line AQ is a tangent. If OP=3 and m(arc PM)=120^@, determine AP. by Maths experts to help you in doubts & scoring excellent marks in Class 10 exams.
Updated on:21/07/2023Topper's Solved these Questions
- CIRCLEBOOK - TARGET PUBLICATIONCHAPTER - CIRCLEEXERCISE - Chapter Assessment
14 Videos
- CIRCLEBOOK - TARGET PUBLICATIONCHAPTER - CIRCLEEXERCISE - Multiple Choice Question
27 Videos
- CHALLENGING QUESTIONS BOOK - TARGET PUBLICATIONCHAPTER - CHALLENGING QUESTIONS EXERCISE - CHAPTER-1 :Linear Equations in Two Variable
1 Videos
- CO-ORDINATE GEOMETRYBOOK - TARGET PUBLICATIONCHAPTER - CO-ORDINATE GEOMETRYEXERCISE - CHAPTER ASSESSMENT
15 Videos
Similar Questions
If two circles with diameter 8cm and 6 cm touch externally,
then the distance between their centres is ______.
View SolutionConcentric Circles have the same______.
View SolutionSum of two numbers is 97. If the greater number is divided by the the smaller, the quotient is 7 and the remainder is 1. Find the numbers.
View SolutionChoose the correct alternative.
(i) The distance of Q (3,-1) from the origin is
View SolutionIn the given figure (not to scale), O is the centre of the circle. A,B,C and D are concyclic and AB=CD . If /_MON =120^(@) , then find /_ OPN .
View SolutionHow many lines of symmetry does the above figure have ?
View SolutionDetermine the point of symmetry of a regular hexagon.
View SolutionDtermine the images of the following figure about the given line :
View SolutionMatch the following Column A to Column B

View SolutionMatch the following Column A to Column B

View SolutionMatch the following Column A to Column B

View SolutionFind the area of the figure given below.

View SolutionThe area of the shaded part in the figure given below is ______.

View SolutionThe inequation represented by the graph given below is :
View SolutionThe inequation that best describes the graph given below is _________
View SolutionThe inequation that best describes the following graph is _________
View Solution
