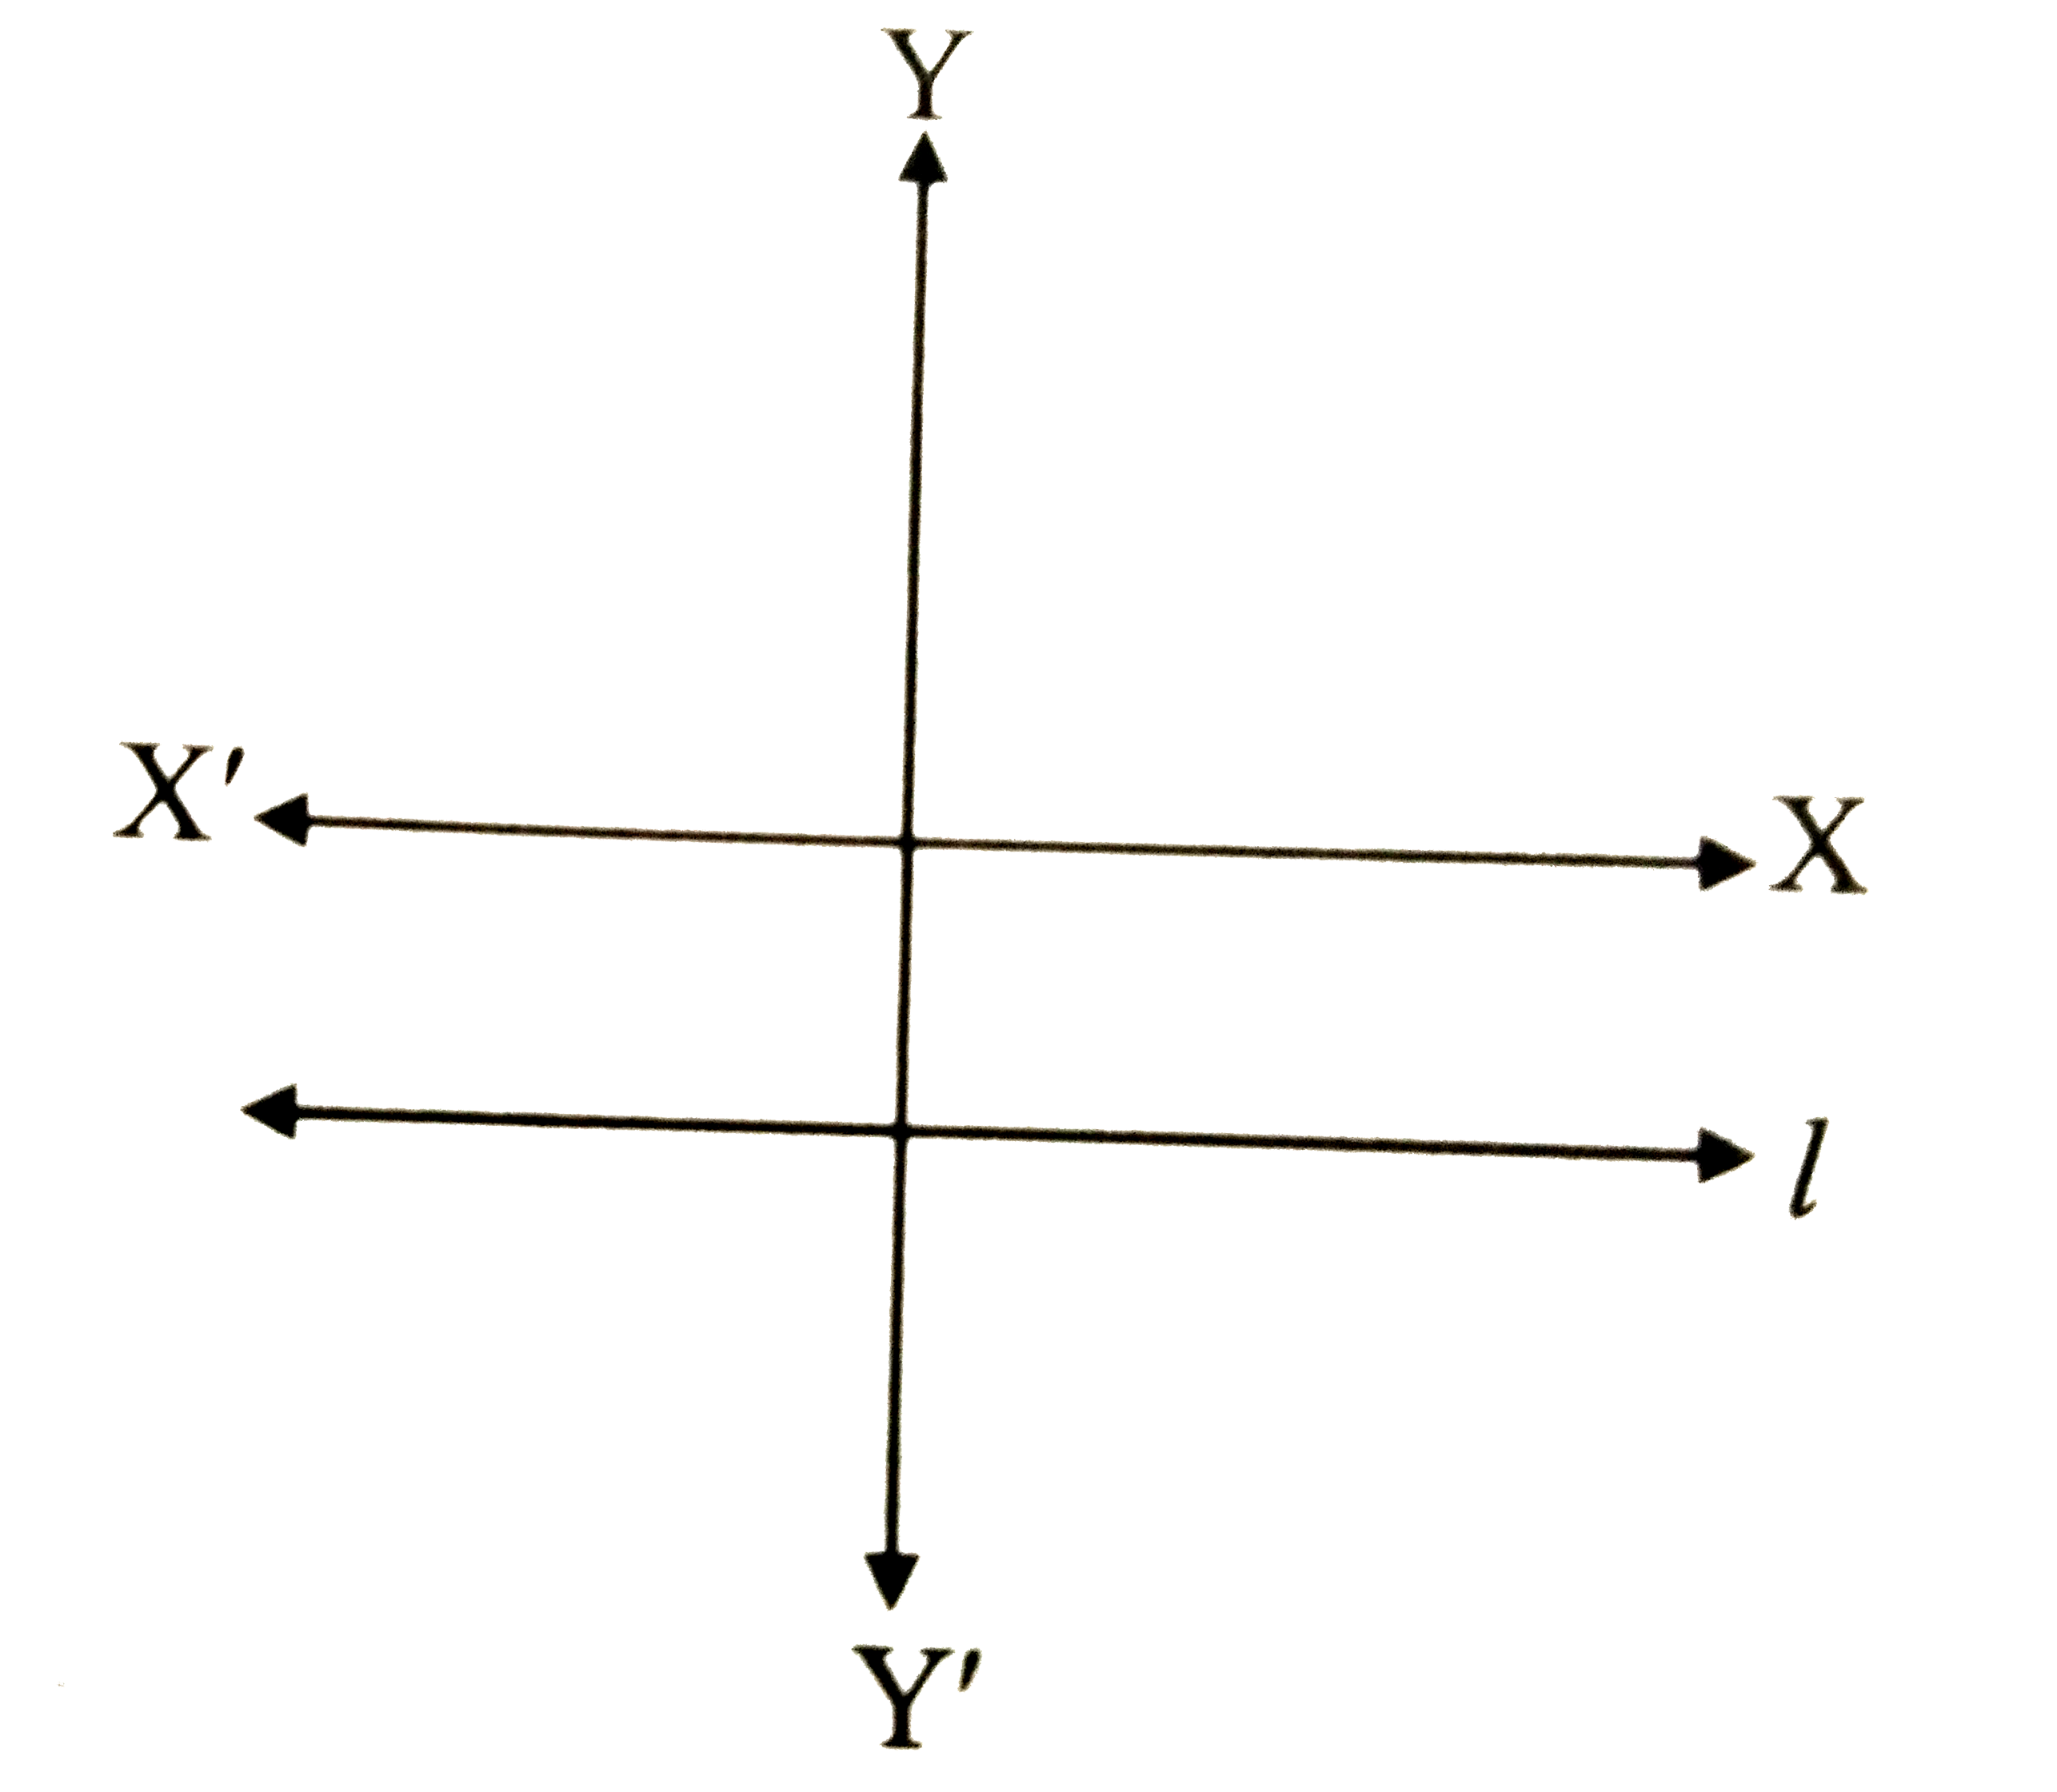
In the figure , line l is parallel to X -axis . Which of the following statement is true ?
 Solution in Marathi
(a) The slope is zero .
(b) The slope cannot be determined .
(c) The slope is positive.
(d) The slope is negative.
The correct Answer is:A
Step by step video & image solution for In the figure , line l is parallel to X -axis . Which of the following statement is true ? by Maths experts to help you in doubts & scoring excellent marks in Class 10 exams.
Updated on:21/07/2023Topper's Solved these Questions
- CO-ORDINATE GEOMETRYBOOK - TARGET PUBLICATIONCHAPTER - CO-ORDINATE GEOMETRYEXERCISE - ADDITIONAL PROBLEMS FOR PRACTICE
33 Videos
- CO-ORDINATE GEOMETRYBOOK - TARGET PUBLICATIONCHAPTER - CO-ORDINATE GEOMETRYEXERCISE - CHAPTER ASSESSMENT
15 Videos
- CO-ORDINATE GEOMETRYBOOK - TARGET PUBLICATIONCHAPTER - CO-ORDINATE GEOMETRYEXERCISE - ACTIVITIES FOR PRACTICE
4 Videos
- CIRCLEBOOK - TARGET PUBLICATIONCHAPTER - CIRCLEEXERCISE - Chapter Assessment
14 Videos
- FINANCIAL PLANNING BOOK - TARGET PUBLICATIONCHAPTER - FINANCIAL PLANNING EXERCISE - Chapter Assement
15 Videos
Similar Questions
Using distance formula, show that the points (1,5),(2,4) and
(3,3) are collinear.
View SolutionChoose the correct alternative.
(i) The distance of Q (3,-1) from the origin is
View SolutionFind the point on X-axis which is equidisant from A(-3,4) and B(1,-4)
View SolutionIf two circles with diameter 8cm and 6 cm touch externally,
then the distance between their centres is ______.
View SolutionGSTIN is ...... Identification number.
View SolutionHow many lines of symmetry does the above figure have ?
View SolutionWhich of the following are correct chain isomers of butane ? (i)
View SolutionDetermine the point of symmetry of a regular hexagon.
View SolutionComplete adjectant figure so that X-axis and Y-axis are the lines of symmetry of the completed figure.
View SolutionDtermine the images of the following figure about the given line :
View SolutionMatch the following Column A to Column B

View SolutionMatch the following Column A to Column B

View SolutionMatch the following Column A to Column B

View SolutionThe inequation represented by the graph given below is :
View SolutionThe inequation that best describes the graph given below is _________
View SolutionThe inequation that best describes the following graph is _________
View Solution
