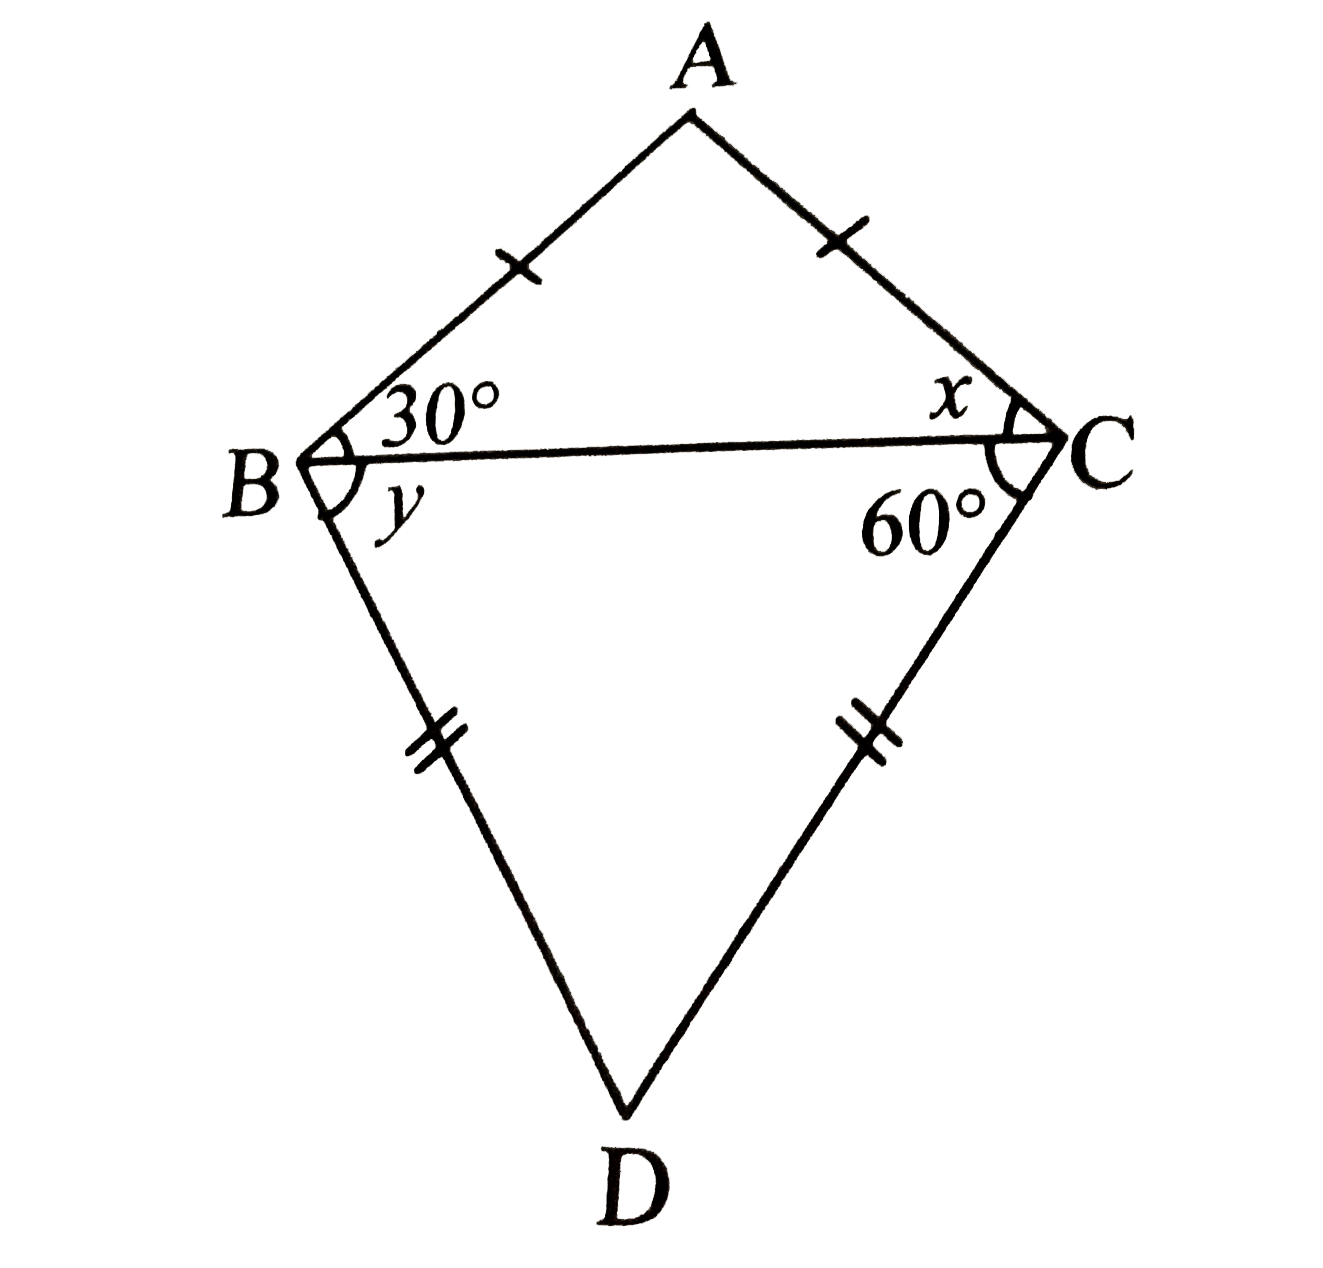
Find the values of x and y using the information shown in the figure.
 Solution in Marathi
The correct Answer is:x=30∘,y=60∘
Step by step video & image solution for Find the values of x and y using the information shown in the figure. by Maths experts to help you in doubts & scoring excellent marks in Class 10 exams.
Updated on:21/07/2023Topper's Solved these Questions
- CHALLENGING QUESTIONS BOOK - TARGET PUBLICATIONCHAPTER - CHALLENGING QUESTIONS EXERCISE - QUADRILATERALS
15 Videos
- CHALLENGING QUESTIONS BOOK - TARGET PUBLICATIONCHAPTER - CHALLENGING QUESTIONS EXERCISE - SURFACE AREA AND VOLUME
25 Videos
- CHALLENGING QUESTIONS BOOK - TARGET PUBLICATIONCHAPTER - CHALLENGING QUESTIONS EXERCISE - PARALLES LINES
7 Videos
- BOARD QUESTION PAPER: MARCH 2019BOOK - TARGET PUBLICATIONCHAPTER - BOARD QUESTION PAPER: MARCH 2019EXERCISE - (Solve the following questions (Any three):
2 Videos
- CIRCLEBOOK - TARGET PUBLICATIONCHAPTER - CIRCLEEXERCISE - Chapter Assessment
14 Videos
Similar Questions
□PQRS is a parallelogram. If ∠P=60∘ then find ∠Q
View SolutionSide of a cube is 4 cm. Find ratio of its total surface area and vertical surface area.
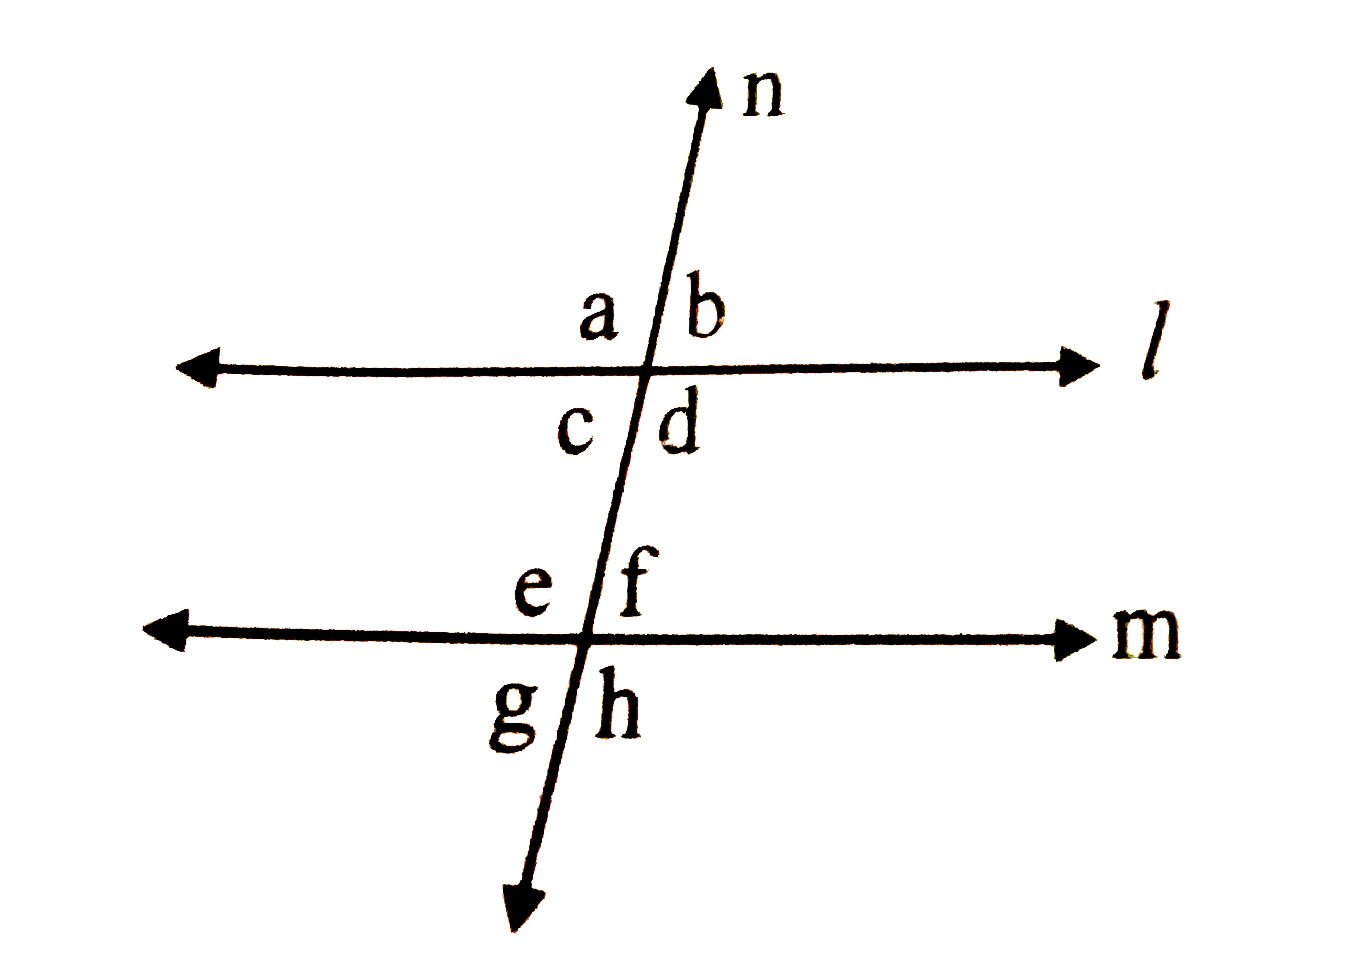
View SolutionAs shown in the figure, if lines /and m are parallel,
then write algebraic equations using the property of interior angles.

View SolutionIn ΔPQR ,seg PM is a median , PM=9 and PQ∘+PR2=290. Find the length of QR.
View SolutionIf two circles with diameter 8cm and 6 cm touch externally,
then the distance between their centres is ______.
View SolutionDetermine the point of symmetry of a regular hexagon.
View SolutionDtermine the images of the following figure about the given line :
View SolutionMatch the following Column A to Column B

View SolutionMatch the following Column A to Column B

View SolutionMatch the following Column A to Column B

View SolutionFind the area of figure given below.

View SolutionFind the perimeter of the figure given below.

View SolutionFind the area of the figure given below.

View SolutionThe inequation represented by the graph given below is :
View SolutionThe inequation that best describes the graph given below is _________
View SolutionThe inequation that best describes the following graph is _________
View Solution
