The following table shows frequency distribution of marks of 100 students of 10th class which they obtianed in a practice examination. Find the median of the marks.
 Solution in Marathi
The correct Answer is:57.33
Step by step video & image solution for The following table shows frequency distribution of marks of 100 students of 10^(th) class which they obtianed in a practice examination. Find the median of the marks. by Maths experts to help you in doubts & scoring excellent marks in Class 10 exams.
Updated on:21/07/2023Topper's Solved these Questions
- STATISTICSBOOK - TARGET PUBLICATIONCHAPTER - STATISTICSEXERCISE - Chapter Assessment
5 Videos
- STATISTICSBOOK - TARGET PUBLICATIONCHAPTER - STATISTICSEXERCISE - Practise Set 6.1
1 Videos
- STATISTICSBOOK - TARGET PUBLICATIONCHAPTER - STATISTICSEXERCISE - Multiple Choice Questions
13 Videos
- SIMILARITY BOOK - TARGET PUBLICATIONCHAPTER - SIMILARITY EXERCISE - Chapter Assessment
17 Videos
- TRIGONOMETRY BOOK - TARGET PUBLICATIONCHAPTER - TRIGONOMETRY EXERCISE - Chapter Assessment
17 Videos
Similar Questions
If the assumed mean, A=45 and ¯d=9, then the value of ¯¯¯X is_______.
View SolutionIn the following table, the toll paid by drivers and the number of vehicles is shown. Find the mean of the toll by 'assumed mean' method.

View SolutionIf ¯d=−20.83, ¯¯¯X=254.17, then A=?
View SolutionChoose the correct alternative.
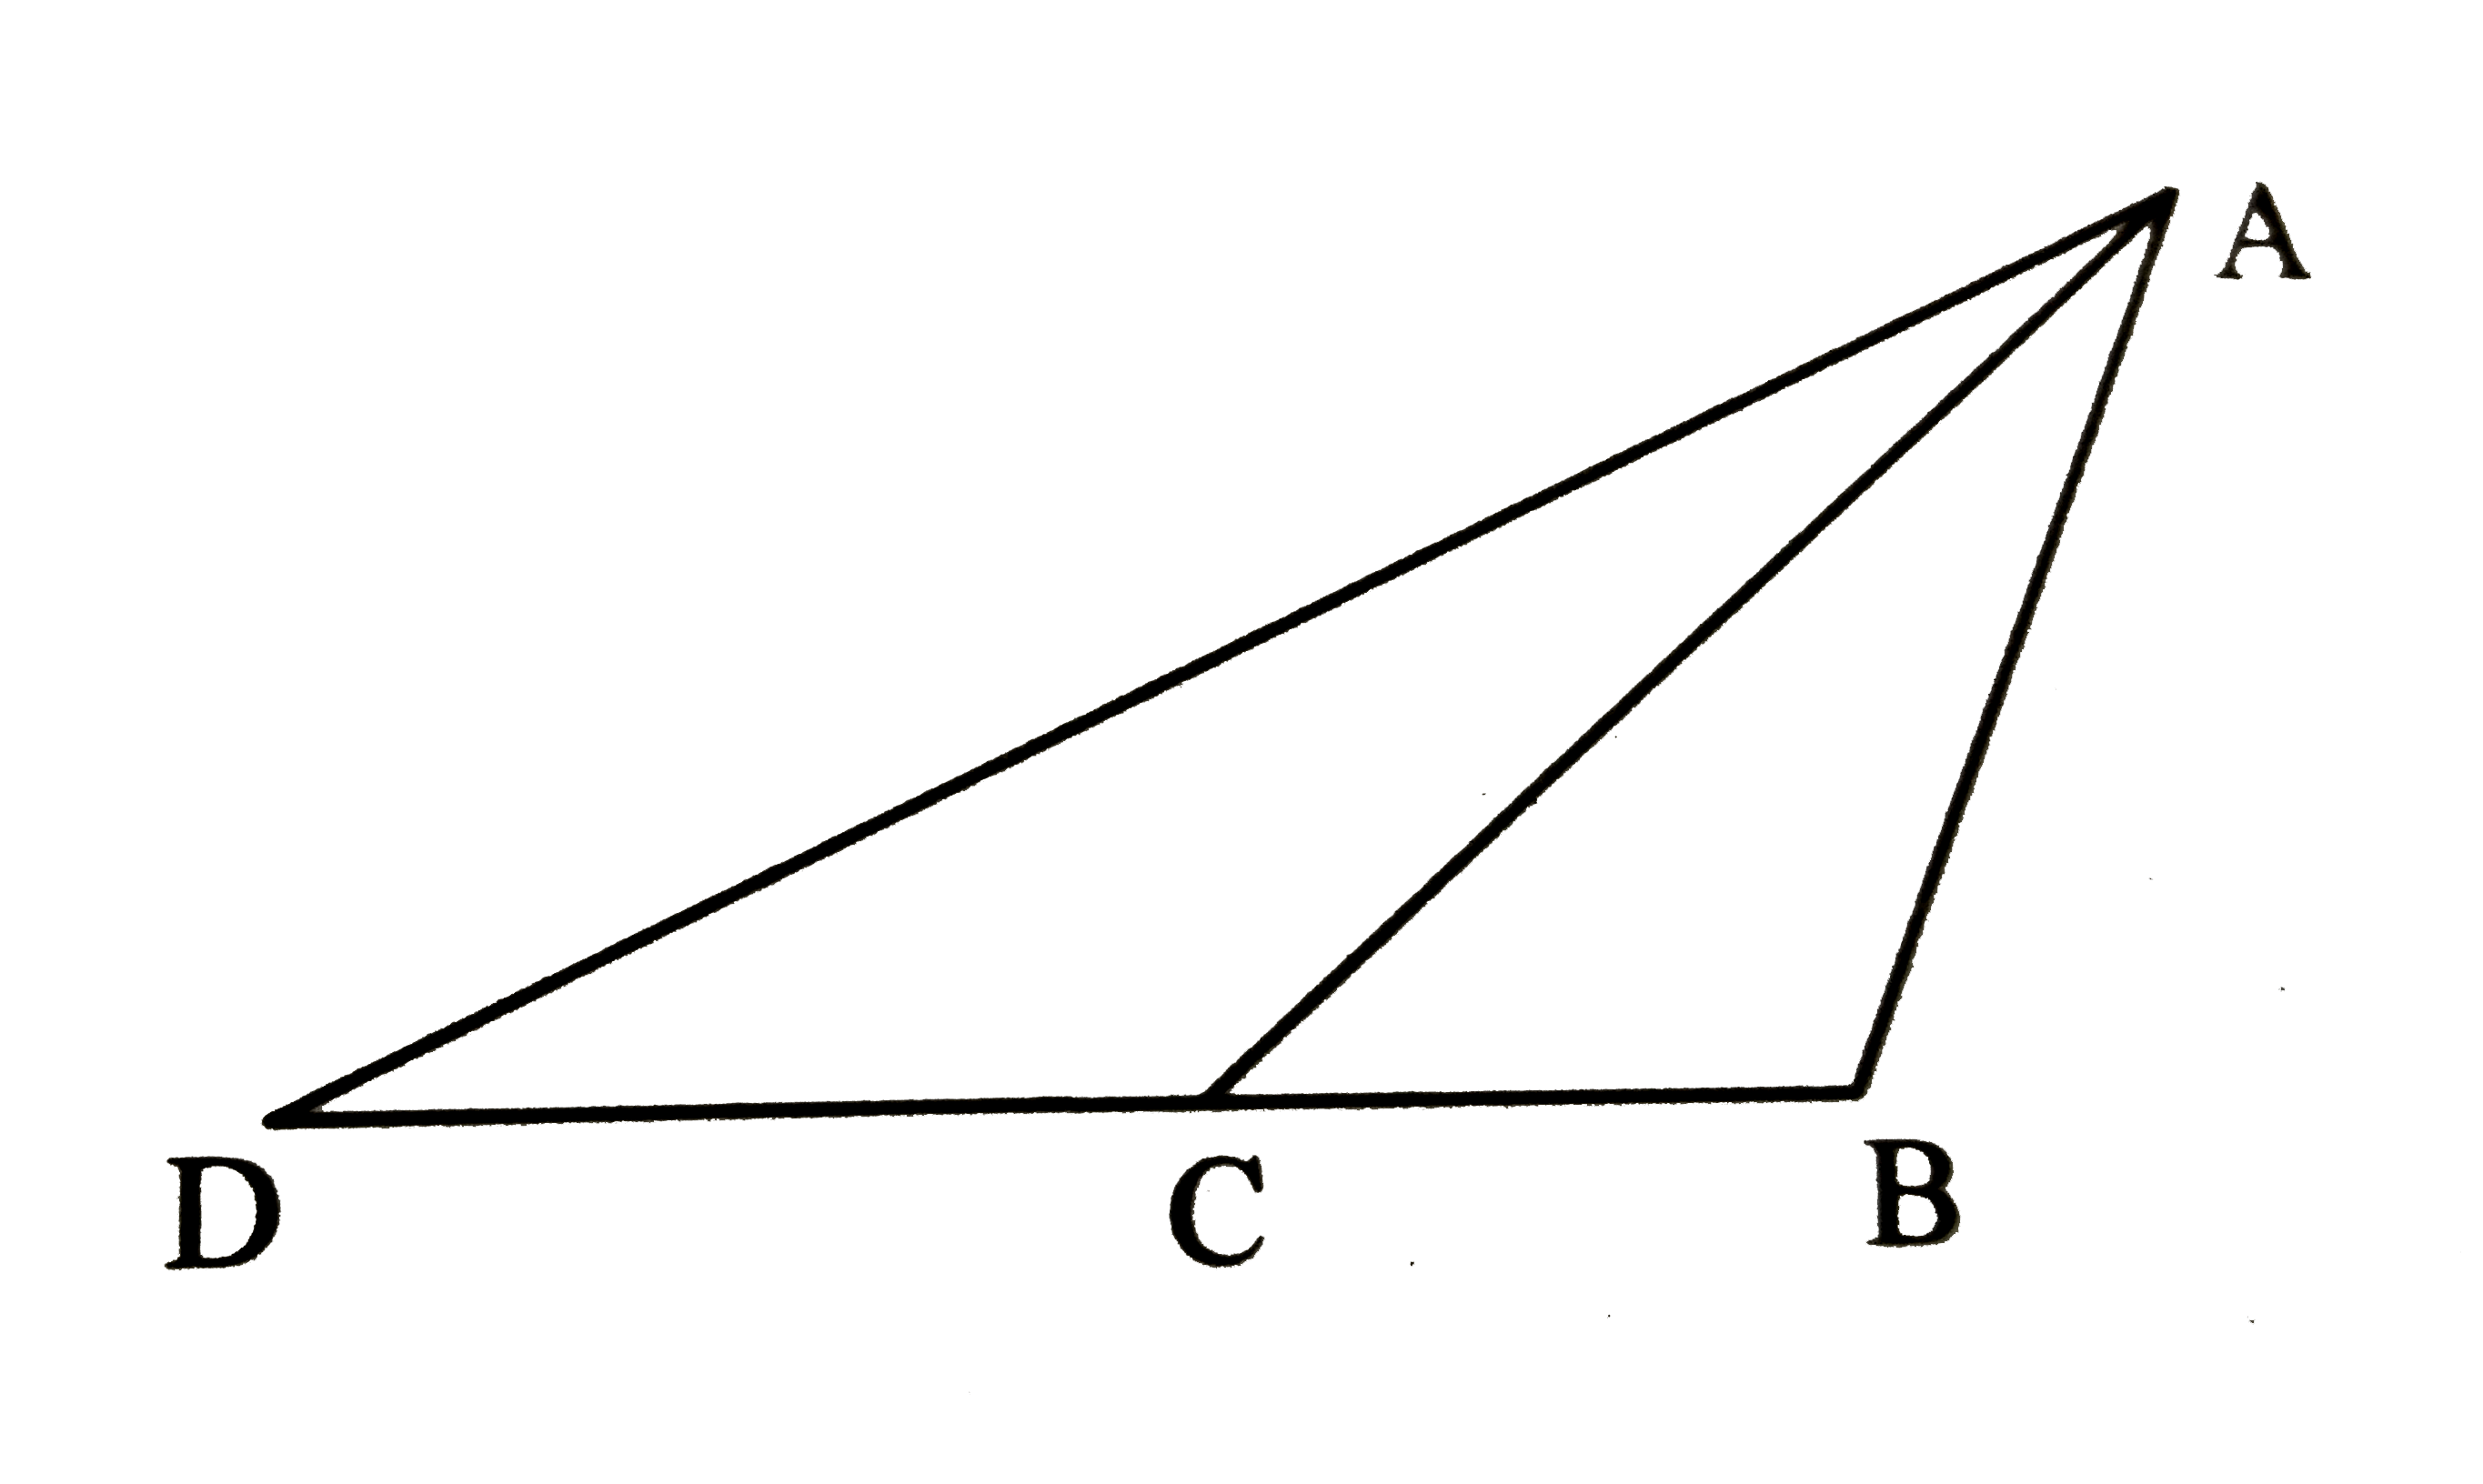
In the given figure, if BC = 3cm and BD = 7 cm , then A(ΔABC)A(ΔABD)=

View Solutioncot60∘ =
View SolutionWhich of the following are correct chain isomers of butane ? (i)
View SolutionDetermine the point of symmetry of a regular hexagon.
View SolutionDtermine the images of the following figure about the given line :
View SolutionMatch the following Column A to Column B

View SolutionMatch the following Column A to Column B

View SolutionMatch the following Column A to Column B

View SolutionFind the area of the figure given below.

View SolutionThe inequation represented by the graph given below is :
View SolutionThe inequation that best describes the graph given below is _________
View SolutionThe inequation that best describes the following graph is _________
View Solution
