The modal class of the data given below is ________.
 Solution in Marathi
10−20
20−30
30−40
40−50
The correct Answer is:B
Step by step video & image solution for The modal class of the data given below is ________. by Maths experts to help you in doubts & scoring excellent marks in Class 10 exams.
Updated on:21/07/2023Topper's Solved these Questions
- STATISTICSBOOK - TARGET PUBLICATIONCHAPTER - STATISTICSEXERCISE - Practise Set 6.1
1 Videos
- STATISTICSBOOK - TARGET PUBLICATIONCHAPTER - STATISTICSEXERCISE - Problem Set-6
5 Videos
- STATISTICSBOOK - TARGET PUBLICATIONCHAPTER - STATISTICSEXERCISE - Additional Problems for Practice
10 Videos
- SIMILARITY BOOK - TARGET PUBLICATIONCHAPTER - SIMILARITY EXERCISE - Chapter Assessment
17 Videos
- TRIGONOMETRY BOOK - TARGET PUBLICATIONCHAPTER - TRIGONOMETRY EXERCISE - Chapter Assessment
17 Videos
Similar Questions
In the following table, the toll paid by drivers and the number of vehicles is shown. Find the mean of the toll by 'assumed mean' method.

View SolutionDifferent expenditures incurred on the construction of a building were shown by a pie diagram. The expenditure of Rs45000 on current was shown by a sector of central angle of 75∘. What was the total expenditure of the construction?
View SolutionRainfall (in cm) recorded in 50 cities on a particular day. Find the mean rainfall by direct method.

View SolutionChoose the correct alternative.
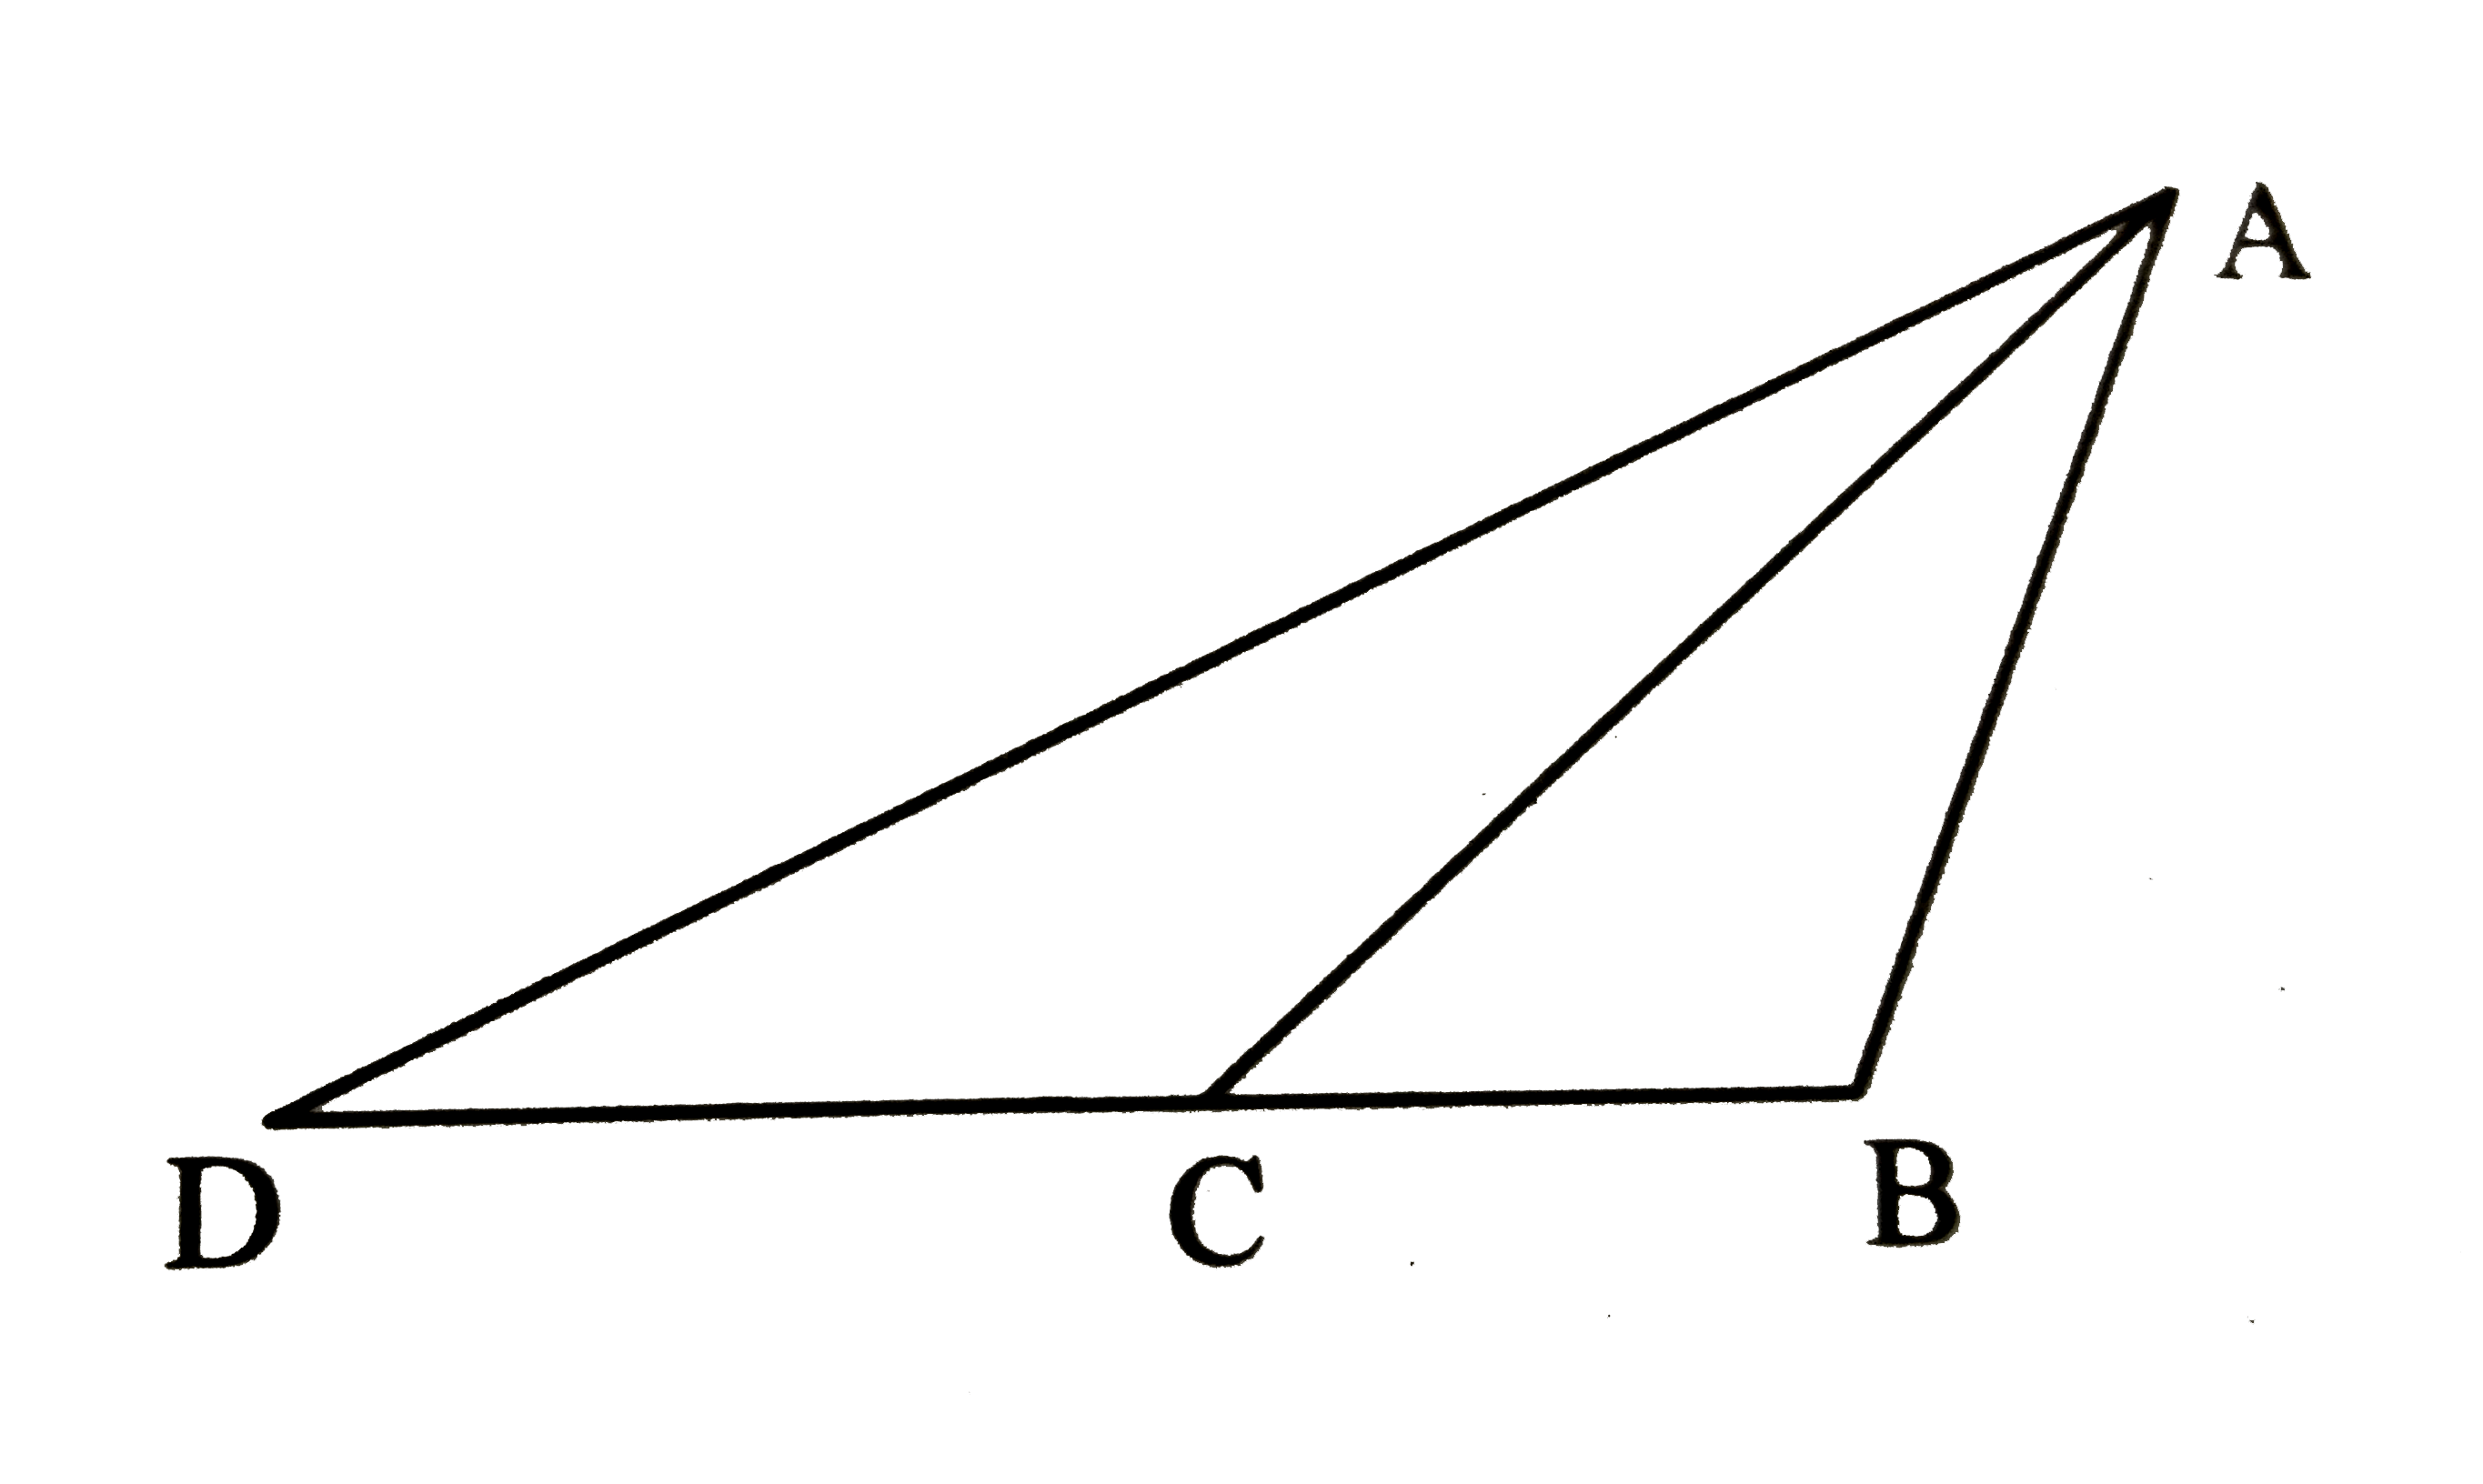
In the given figure, if BC = 3cm and BD = 7 cm , then A(ΔABC)A(ΔABD)=

View Solutioncot60∘ =
View SolutionDetermine the point of symmetry of a regular hexagon.
View SolutionDtermine the images of the following figure about the given line :
View SolutionMatch the following Column A to Column B

View SolutionMatch the following Column A to Column B

View SolutionMatch the following Column A to Column B

View SolutionFind the area of figure given below.

View SolutionFind the perimeter of the figure given below.

View SolutionFind the area of the figure given below.

View SolutionCalculate the volume of the given solid.
ltimg src="https://d10lpgp6xz60nq.cloudfront.net/physics_images/PS_MATH_VII_C06_E03_002_Q01.png" width="80%"gt
View SolutionThe area of the shaded part in the figure given below is ______.

View SolutionThe inequation represented by the graph given below is :
View Solution
