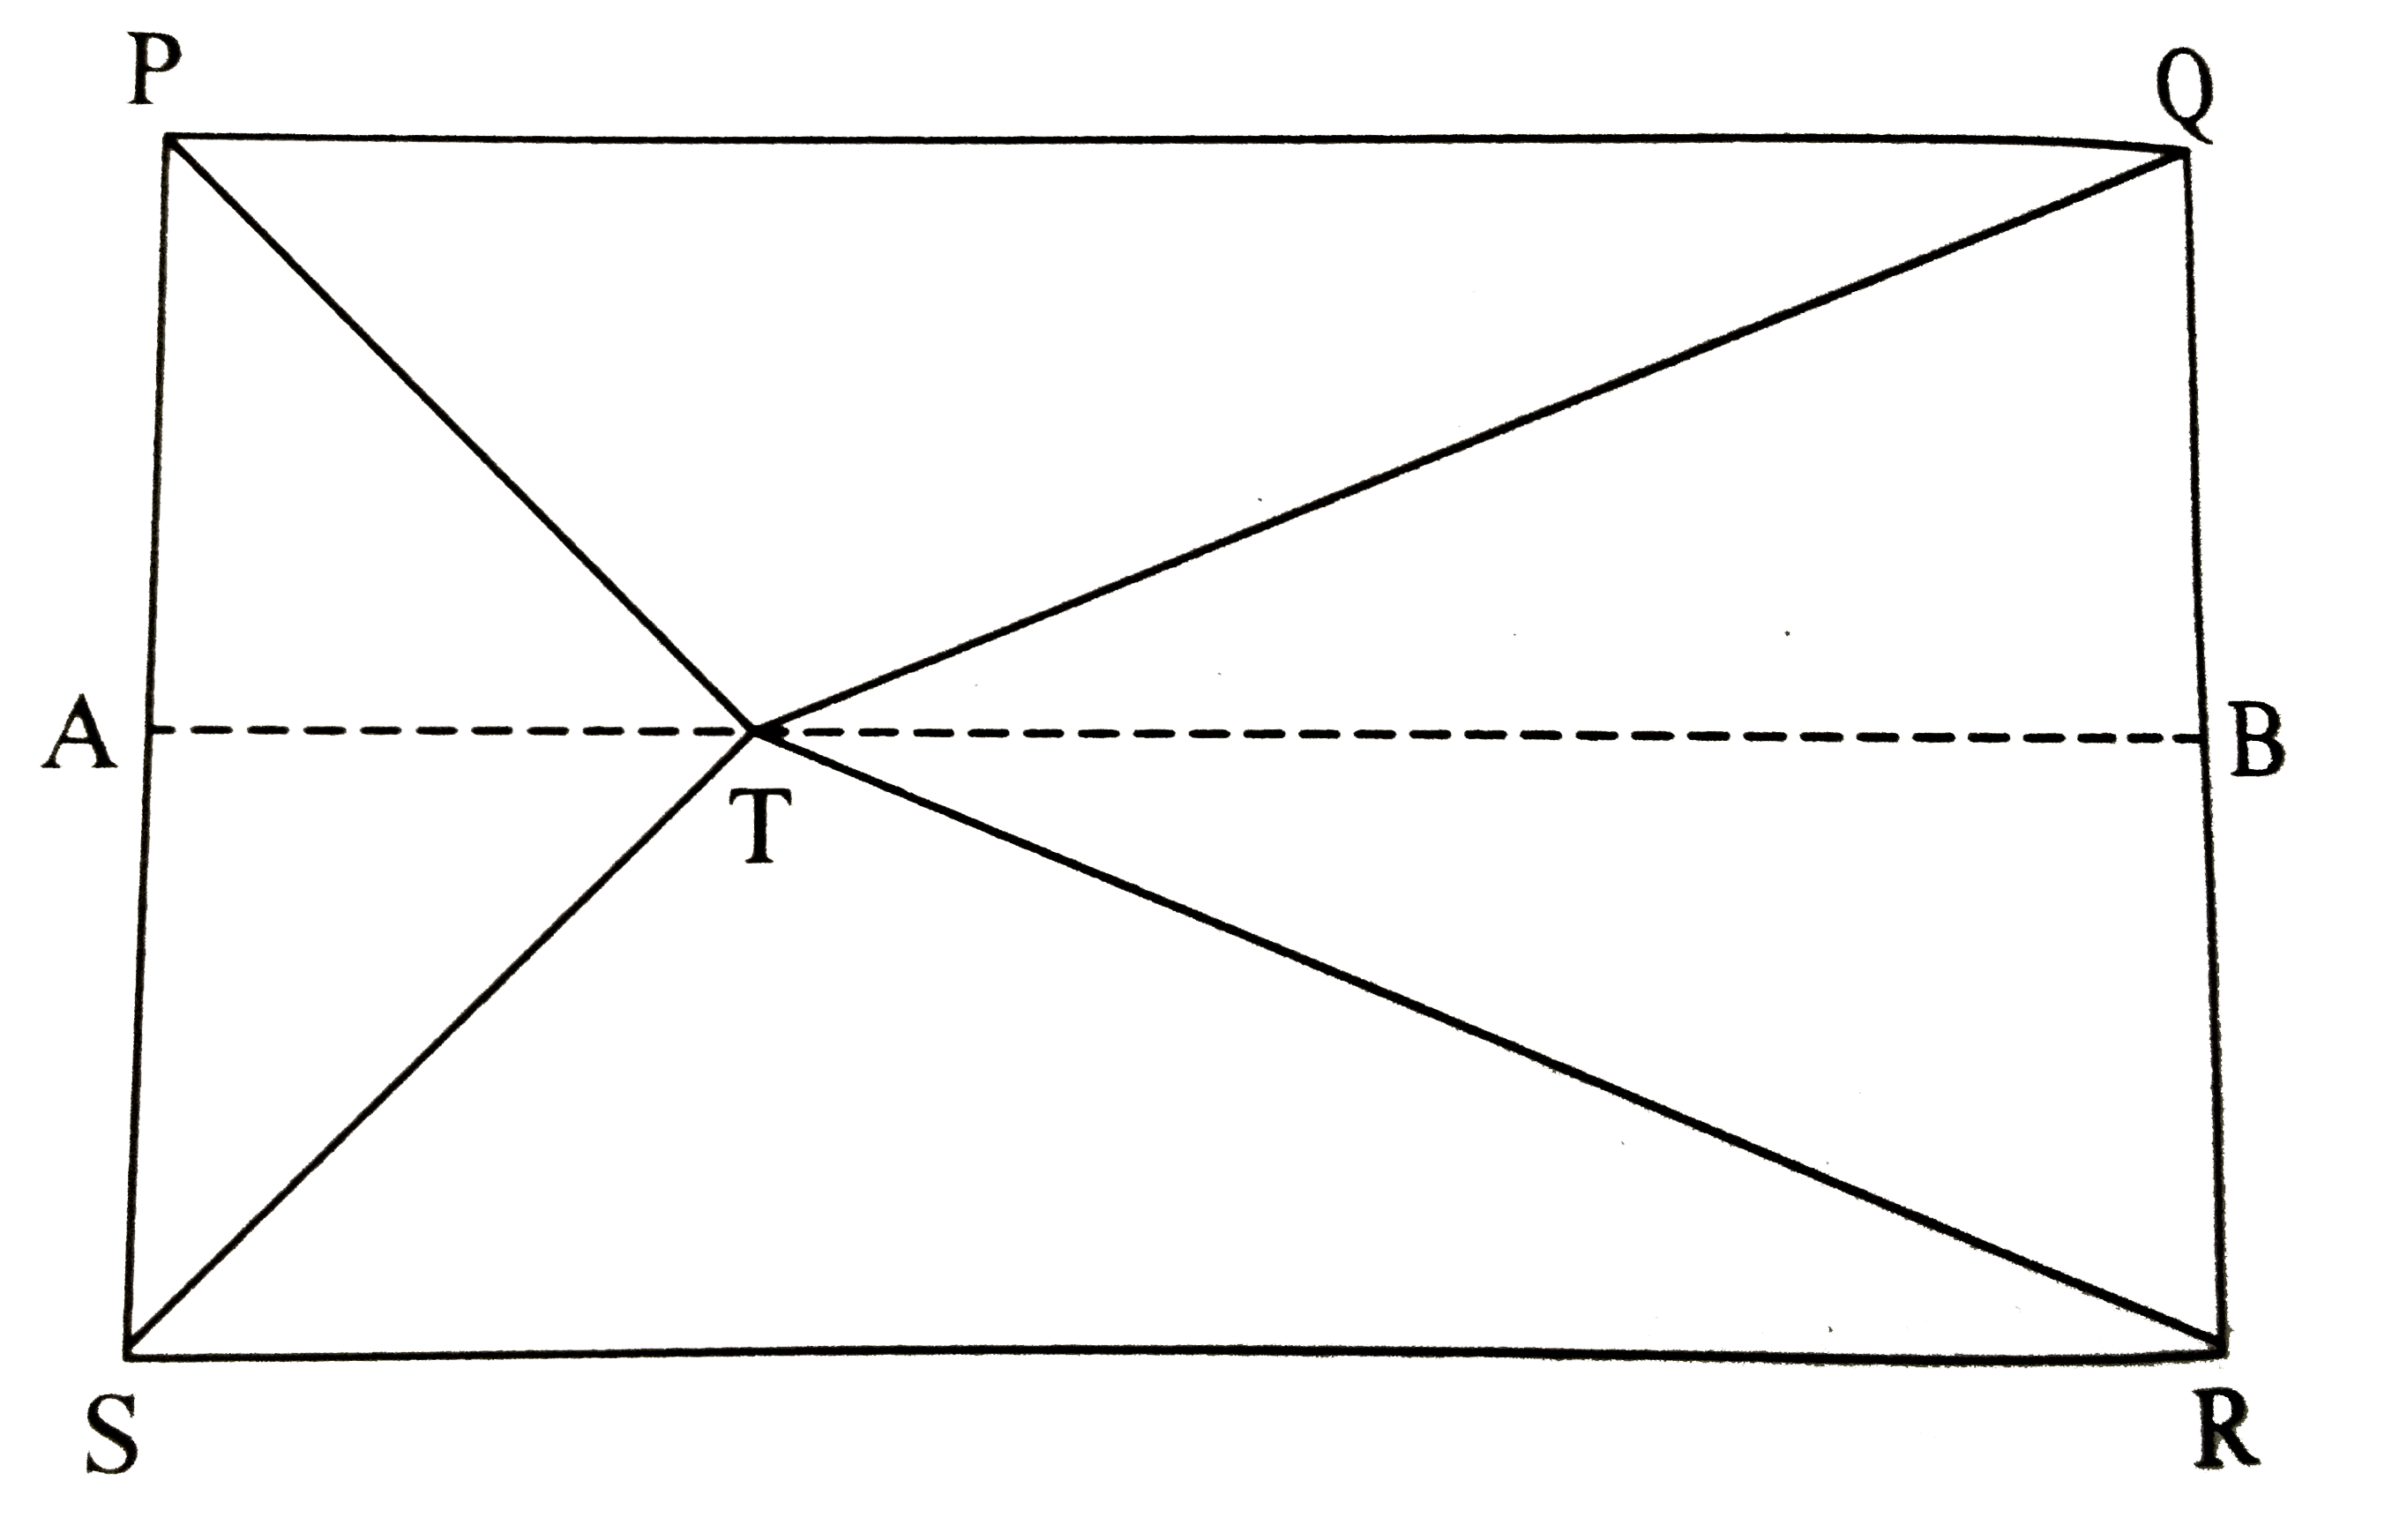
In the figure , point T is in the interior of rectangle PQRS.
Prove that,
TS2+TQ2=TP2+TR2
(As shown in the figure, draw seg AB∣∣ side SR and A−T−B.)
 Solution in Marathi
The correct Answer is:∴TS2+TQ2=TP2+TR2
Step by step video & image solution for In the figure , point T is in the interior of rectangle PQRS. Prove that, TS^(2)+TQ^(2)=TP^(2)+TR^(2) (As shown in the figure, draw seg AB|| side SR and A-T-B.) by Maths experts to help you in doubts & scoring excellent marks in Class 10 exams.
Updated on:21/07/2023Topper's Solved these Questions
- PYTHAGORAS THEOREM BOOK - TARGET PUBLICATIONCHAPTER - PYTHAGORAS THEOREM EXERCISE - Problem set-2
8 Videos
- PYTHAGORAS THEOREM BOOK - TARGET PUBLICATIONCHAPTER - PYTHAGORAS THEOREM EXERCISE - Problem set-10
16 Videos
- PYTHAGORAS THEOREM BOOK - TARGET PUBLICATIONCHAPTER - PYTHAGORAS THEOREM EXERCISE - Practice Set 2.5
1 Videos
- PROBABILITYBOOK - TARGET PUBLICATIONCHAPTER - PROBABILITYEXERCISE - Try This
1 Videos
- QUADRATIC EQUATIONSBOOK - TARGET PUBLICATIONCHAPTER - QUADRATIC EQUATIONSEXERCISE - Chapter Assessment
39 Videos
Similar Questions
Out of the following which is a Pythagorean triplet? a) (1,5,10) b) (3,4,5) c) (2,2,2) d) (5,5,2)
View SolutionFind the height of an equilateral triangle having side 2a.
View SolutionIn △ABC, point M is midpoint of side BC. If AB2+AC2=290cm2 and AM=8 cm, find BC.
View SolutionIn Which of the following experiments possibility of expected
outcome is more ?
(i) Getting I on the upper face when a die is thrown.
(ii) Getting head by tossing a coin.
View SolutionChoose the correct alternative.
(i) Which of the following is a quadratic equation?
View SolutionDetermine the point of symmetry of a regular hexagon.
View SolutionDtermine the images of the following figure about the given line :
View SolutionIn the following figures, PT=4 cm , TQ=6cm and RT=3 cm , then TS=_______________.
View SolutionMatch the following Column A to Column B

View SolutionMatch the following Column A to Column B

View SolutionMatch the following Column A to Column B

View SolutionThe inequation represented by the graph given below is :
View SolutionThe inequation that best describes the graph given below is _________
View SolutionThe inequation that best describes the following graph is _________
View SolutionWhich inequations represent the shaded region in the given figure
View Solution
