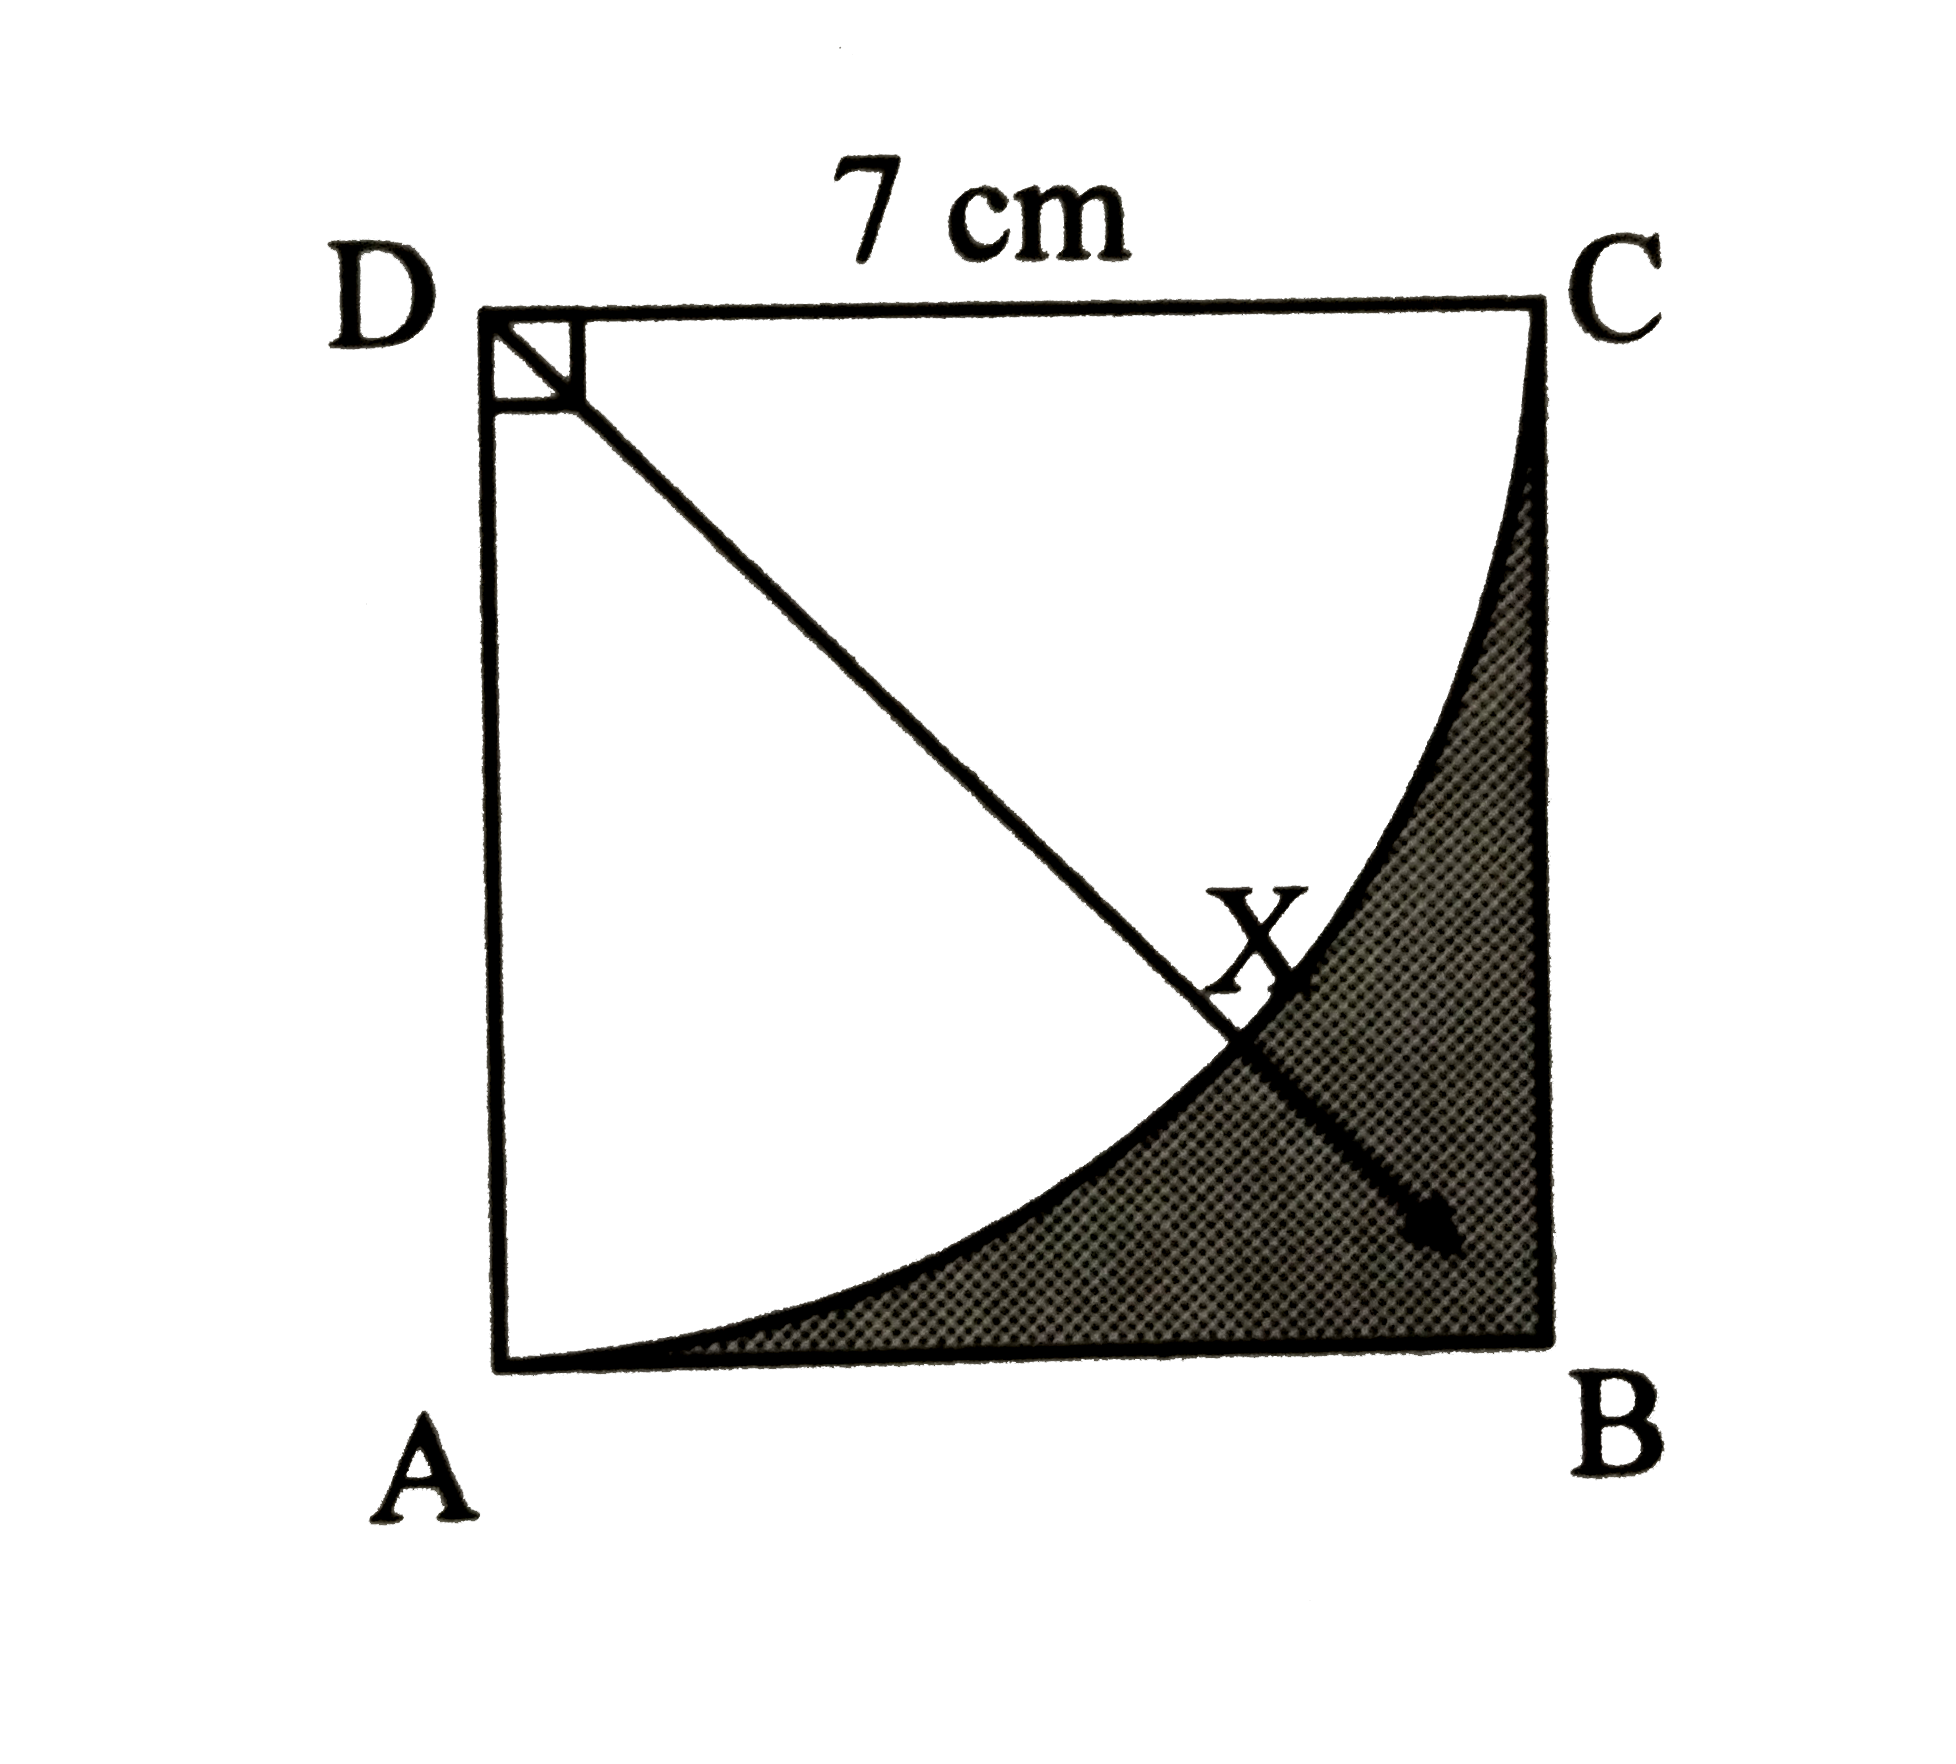
In the given figure side of square ABCD is 7 cm.
With centre D and radius DA, sector D-AXC is drawn. Fill in the following boxes properly and find out the area of the shaded region.
 Solution in Marathi
The correct Answer is:Area of a square
Area of sector (D-AXC)
A (shaded redion) = Area of a square - Area of sector
Step by step video & image solution for In the given figure side of square ABCD is 7 cm. With centre D and radius DA, sector D-AXC is drawn. Fill in the following boxes properly and find out the area of the shaded region. by Maths experts to help you in doubts & scoring excellent marks in Class 10 exams.
Updated on:21/07/2023Topper's Solved these Questions
- MENSURATIONBOOK - TARGET PUBLICATIONCHAPTER - MENSURATIONEXERCISE - Additional Problems for Practice (Based on Practice Set 7.3)
8 Videos
- LINEAR EQUATIONS IN TWO VARIABLES BOOK - TARGET PUBLICATIONCHAPTER - LINEAR EQUATIONS IN TWO VARIABLES EXERCISE - Chapter Assessment
12 Videos
- MODEL QUESTION PAPERBOOK - TARGET PUBLICATIONCHAPTER - MODEL QUESTION PAPEREXERCISE - Questions
17 Videos
Similar Questions
If the sector of a circle with radius 10 cm has central angle 18∘, find the area of the sector. (π=3.14)
View SolutionIf 2x−3y=14 and 5x+2y=16 than
View SolutionIf in ΔABC,∠A=4x∘,∠B=2x∘and∠C=4y∘, then write a linear equation in two variable showing relation between x and y.
View SolutionDetermine the point of symmetry of a regular hexagon.
View SolutionFind the area of the shaded region, given that the radius of each circle is equal to 5 cm.
View SolutionMatch the following Column A to Column B

View SolutionMatch the following Column A to Column B

View SolutionMatch the following Column A to Column B

View SolutionFind the area of figure given below.

View SolutionFind the area of the figure given below.

View SolutionThe area of the shaded part in the figure given below is ______.

View Solution
Find the area of the shaded part in the figure given above.
View SolutionThe inequation represented by the graph given below is :
View SolutionThe inequation that best describes the graph given below is _________
View SolutionThe inequation that best describes the following graph is _________
View SolutionWhich inequations represent the shaded region in the given figure
View Solution
