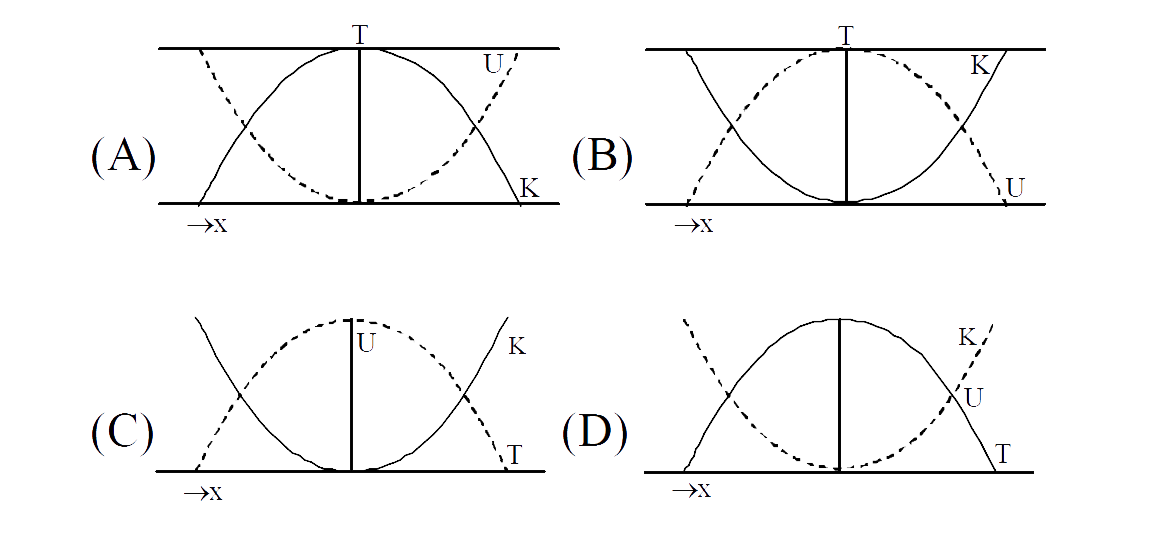
A particle is executing S.H.M. along a straight line. The graph showing the variation of kinetic, potential and total energy K, U and T respectively with displacement is -
 Solution in Marathi


The correct Answer is:A
Step by step video & image solution for A particle is executing S.H.M. along a straight line. The graph showing the variation of kinetic, potential and total energy K, U and T respectively with displacement is - by Physics experts to help you in doubts & scoring excellent marks in Class 12 exams.
Updated on:21/07/2023Similar Questions
The potential energy of a particle executing S.H.M. is 2.5 J, when its displacement is half of amplitude. The total energy of the particle will be
View SolutionFor a particle executing S.H.M., the displacement x is given by x=Acosωt. Identify the graph which represents the variation of potential energy (U) as a function of time t and displacement x.
View SolutionThe potential energy of a particle executing S.H.M. is 2.5 J, when its displacement is half of amplitude. The total energy of the particle will be
View SolutionThe graph showing the variation of K.E. or P.E. with displacement of a harmonic oscillator is a parabola, but that of total energy with displacement is a straight line. Why?
View SolutionPlot graphs showing the variation of kinetic energy, potential energy and total mechanical energy of a particle executing S.H.M with its displacement.
View SolutionDisplacement between maximum potential energy position and maximum kinetic energy position for a particle executing S.H.M is
View SolutionDeduce the expressions for the kinetic energy and potential energy of a particle executing S.H.M. Hence obtain the expression for total energy of a particle performing S.H.M and show that the total energy is conserved. State the factors on which total energy depends.
View Solution
