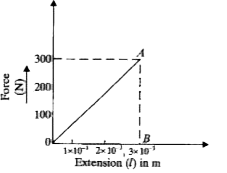
A graph of force against extension of a wire is plotted. The area under the curve is Solution in Marathi
energy density
work done during extension
the elastic constant
coefficient of elasticity
The correct Answer is:B
Step by step video & image solution for A graph of force against extension of a wire is plotted. The area under the curve is by Physics experts to help you in doubts & scoring excellent marks in Class 12 exams.
Similar Questions
The area under force time curve gives
View SolutionIf we plot a graph between force and time, the area under the curve and time - axis gives the value of
04:30View SolutionThe area under force time curve gives
View SolutionThe area under a 'force-displacement' curve gives:
View SolutionWhat is the slope of the graph attained by plotting of dynamic friction against applied force.
02:40View SolutionArea under force-displacement graph is equal to
View SolutionThe force-extension graph of an elastic wire subjected to a certain force is as shown in Figure. From the graph calculate the work done in stretching the wire.
 02:06View Solution

