The graph shows the relation between light intensity and the giving off and taking up of carbon dioxide by the leaves of a plant. Why is most carbon dioxide given off when the light intensity is zero units.
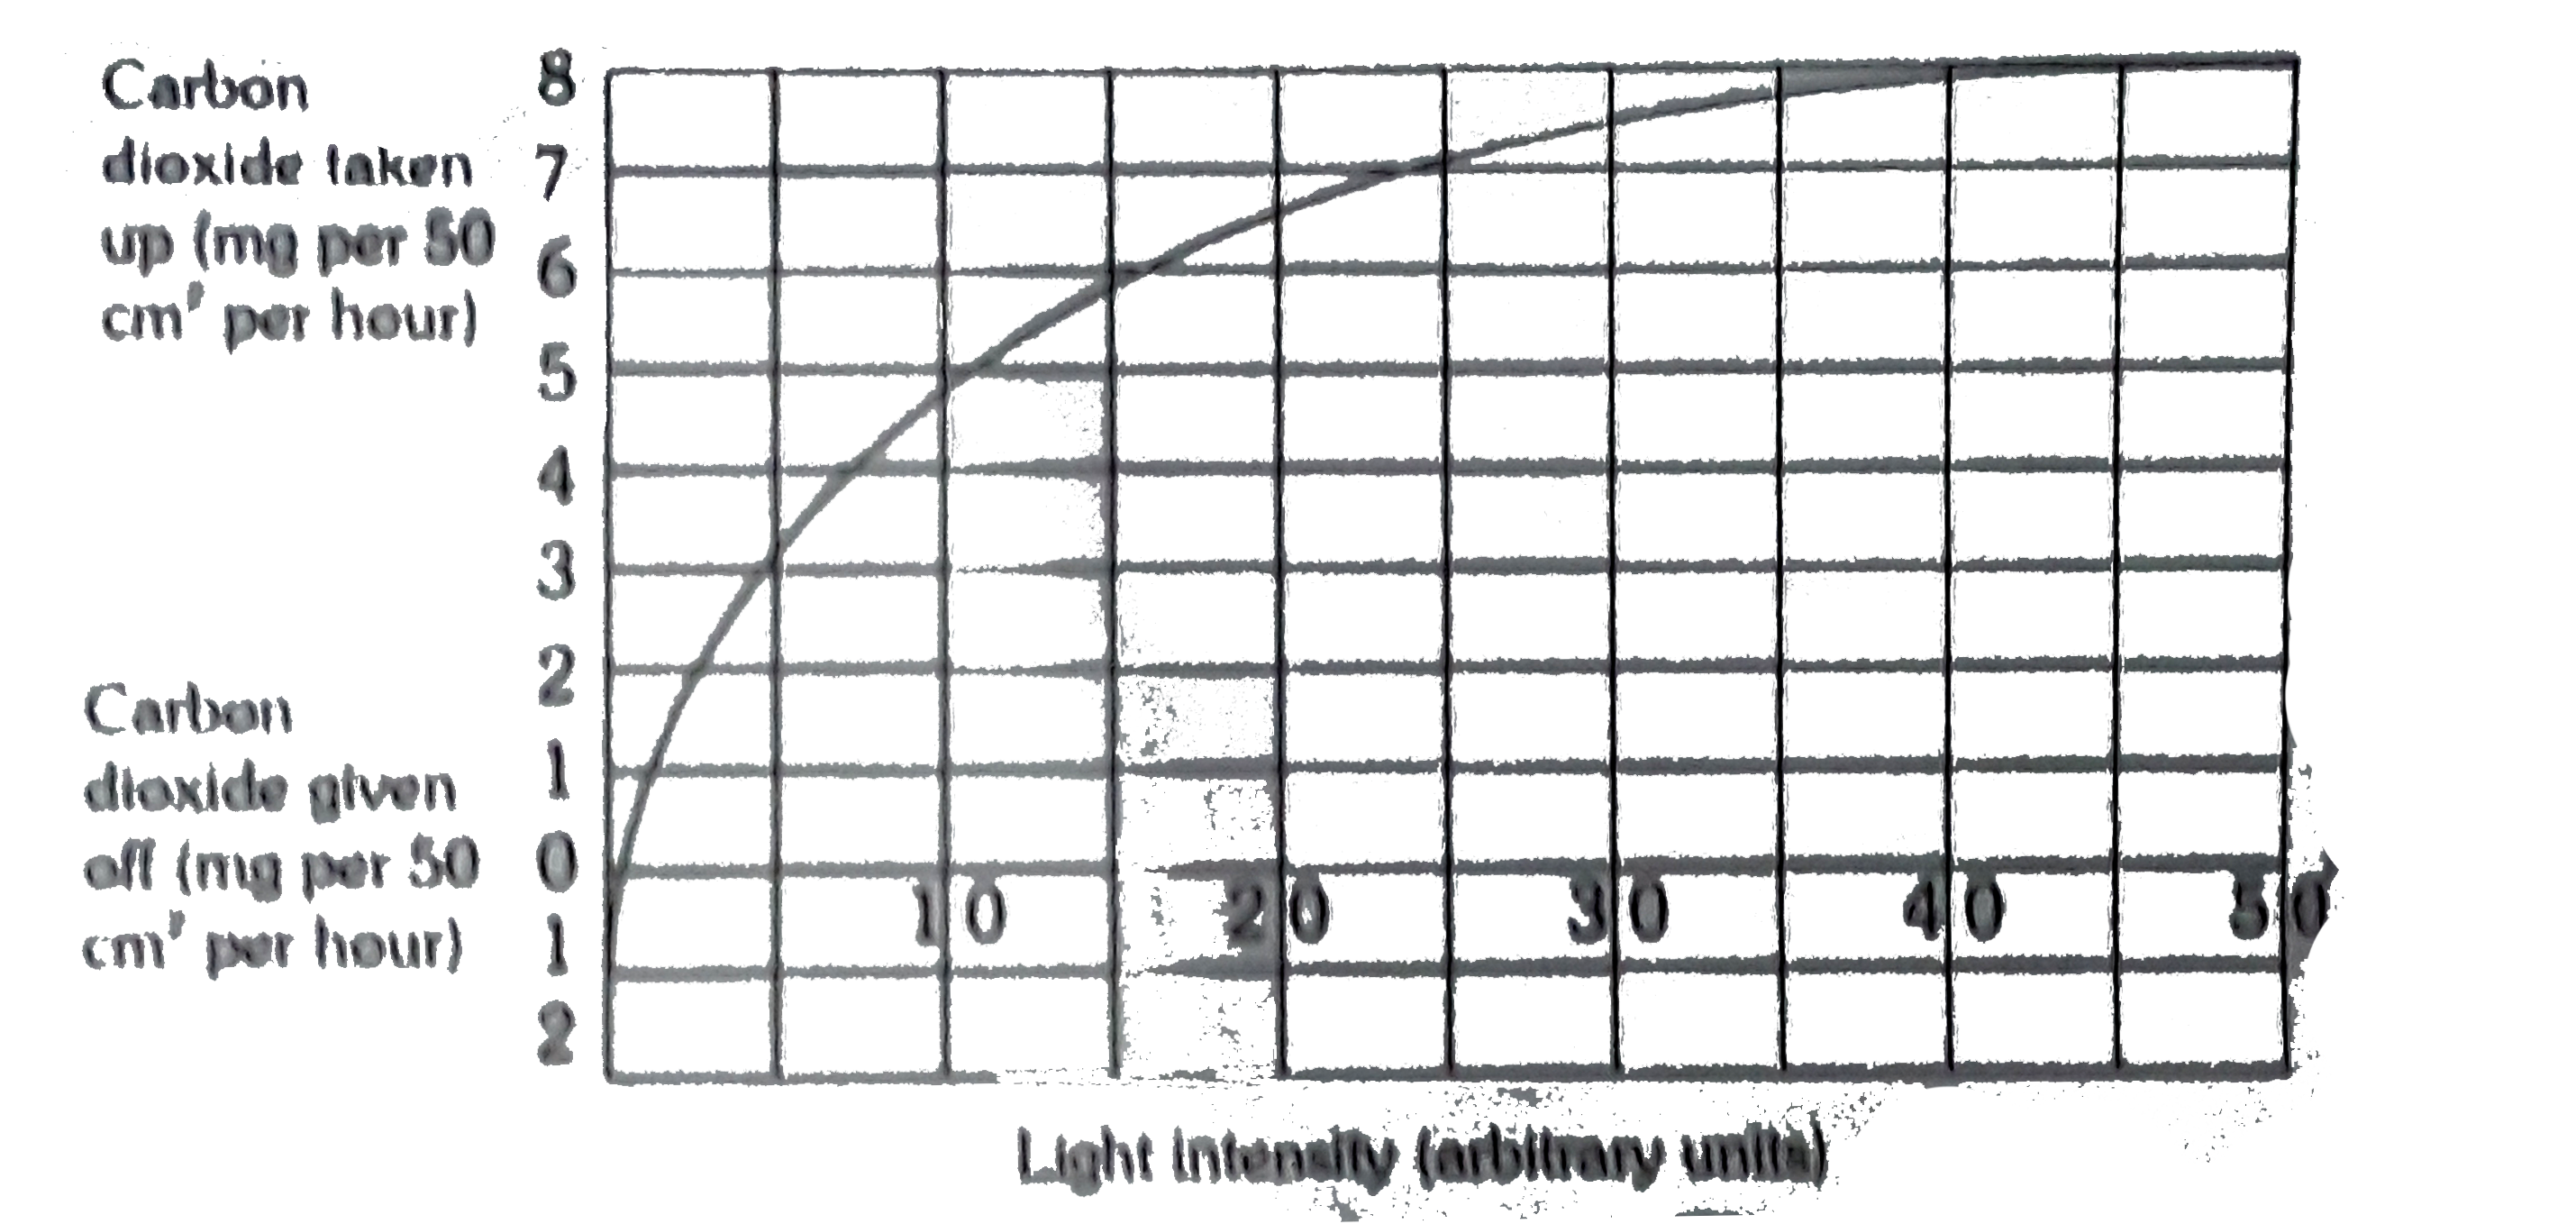
because it is just the start of the experiment
only respiration is taking place at this intensity of light
the rate of photosynthesis is equivalent to the rate of respiration
the rate of photosynthesis is more than the rate of respiration
The correct Answer is:B
Step by step video & image solution for The graph shows the relation between light intensity and the giving off and taking up of carbon dioxide by the leaves of a plant. Why is most carbon dioxide given off when the light intensity is zero units. by Biology experts to help you in doubts & scoring excellent marks in Class 12 exams.
Updated on:21/07/2023Topper's Solved these Questions
Similar Questions
Observe the given graph carefully and choose the correct statements for labelled points, (A to E)
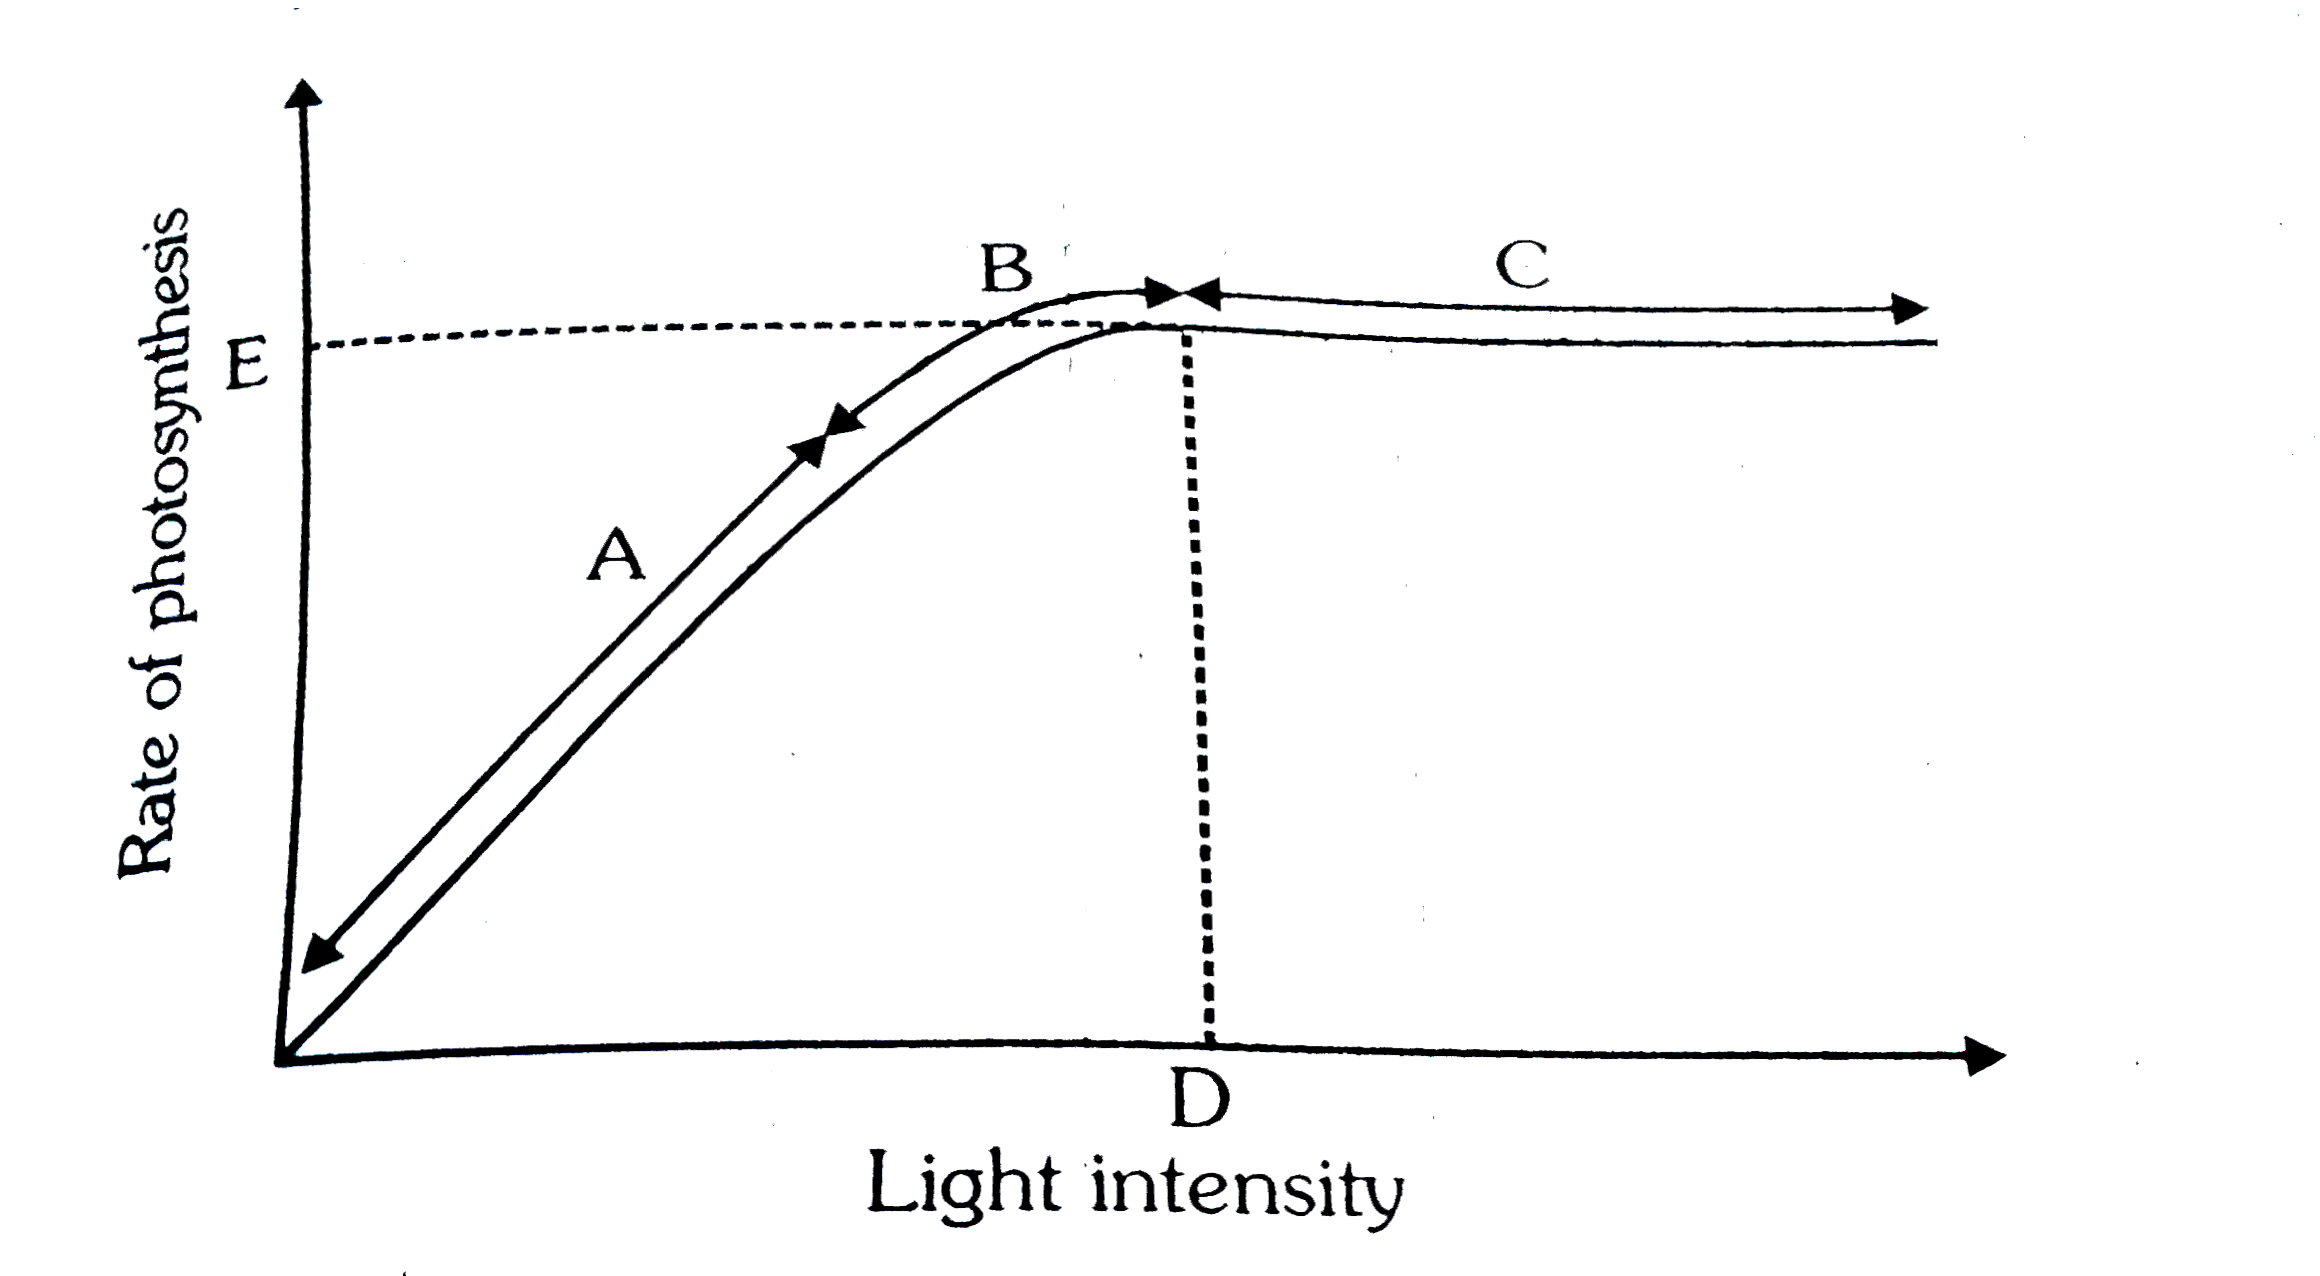 Points:-
(A)- There is a linear relationship between incident light and CO2 fixation rates.
(B)- It is a transition poit where limiting factor changes.
(C)- At this region light intensity is not showing detrimental effect on rate of photosynthesis.
(D)- It shows light saturation point sunlight except for plants in shade or in dense forests.
(E)- This point show maximum rate of photosynthesis at optimum presence of various parameters.
View SolutionWhich of the following plants give higher yields. when they are allowed to grow in carbon dioxide enriched atmosphere?
View Solution
Knowledge Check
Study the given graph showing the efect of light intensity on the rate of photosynthesis. Which of the following statemetns regarding this is correct?
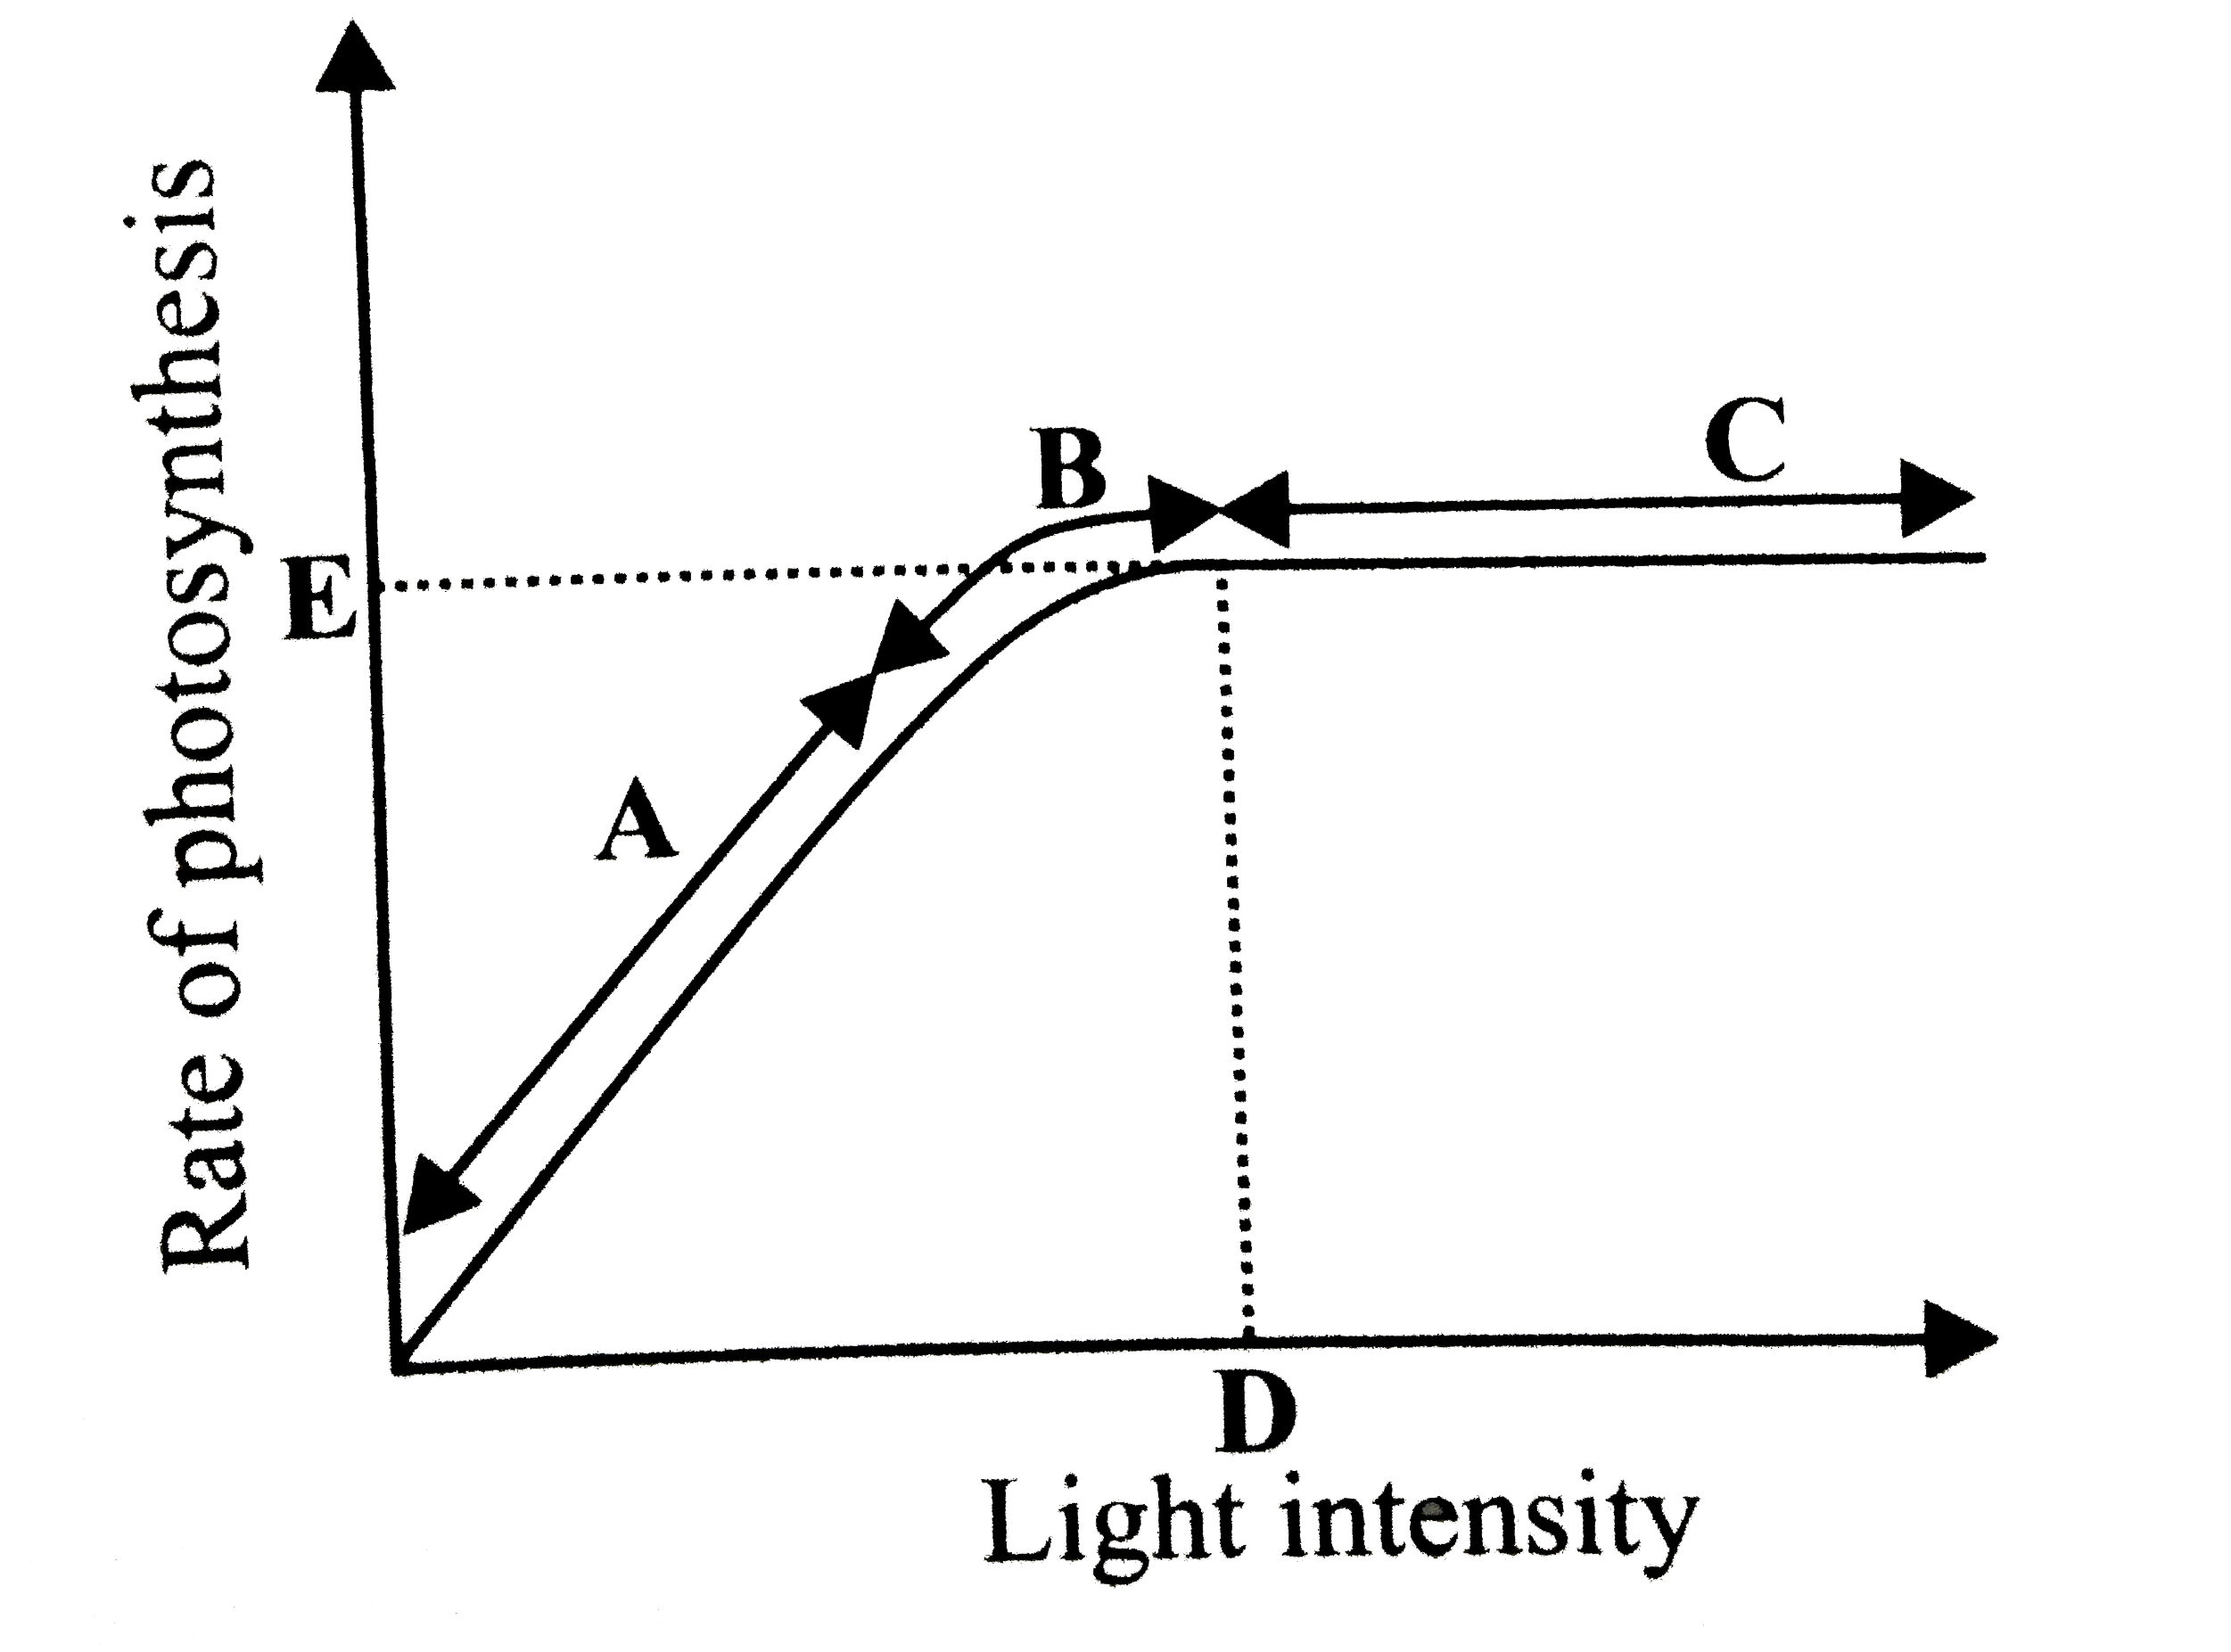 ALight is a limiting factor in the region a.BRegion C represents that rate of photosynthesis is because some other factor became limiting.Cpoint D rrepresents the intensity of light at which some other factor became limitingDAll of these
When two plants L and M were exposed to different light intensities and temperature they showed changes in their rates of photosynthesis. Which have been represented in the following graph.
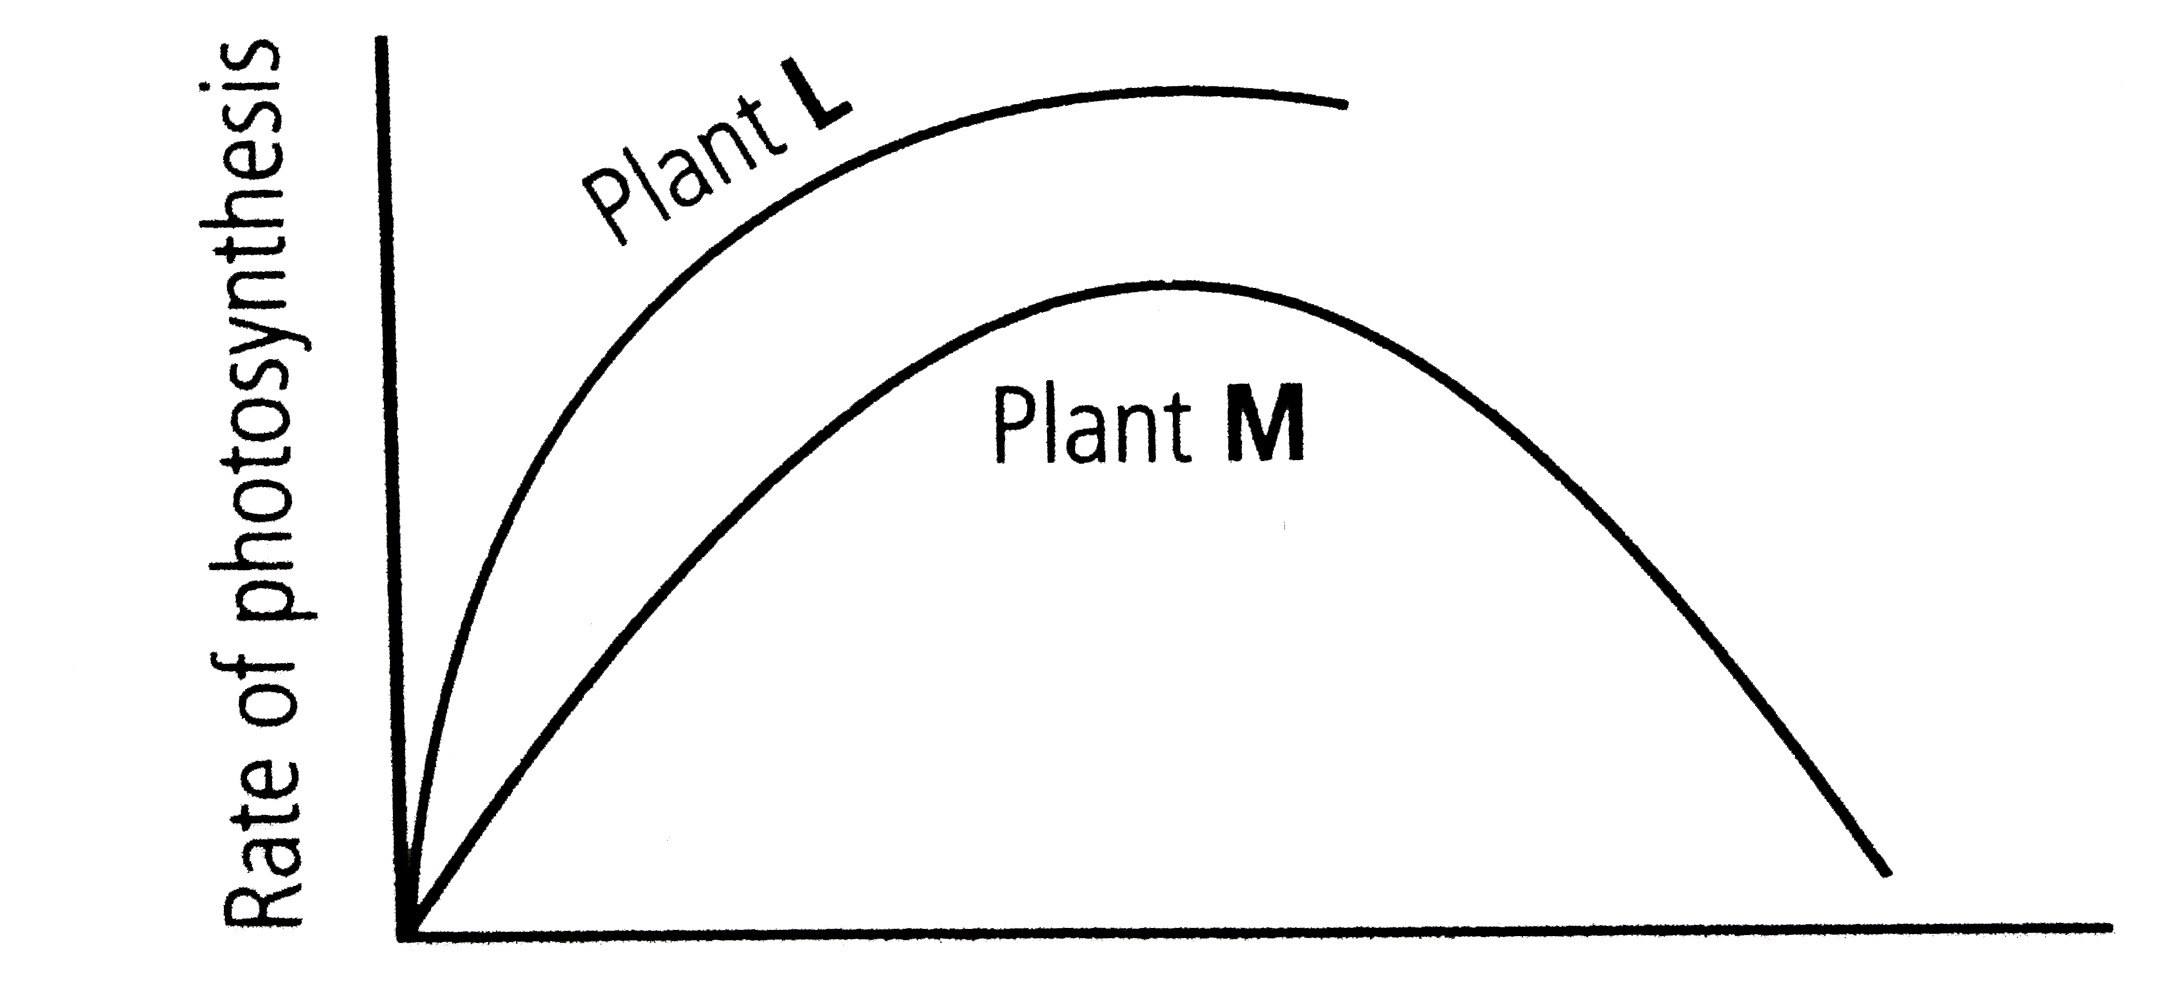
The graph indicates thatAPlant L is a C3 plant for which the light saturation point is 100% of full sunlightBPlant M is a C4 plant for which the optimum temperature s around 20∘CCPlant M is a C3 plant which is more affected at higher temperature and higher light intensity as compared to palnt LDplant L is a C4 plant and cannot function at light intensities above the saturation point.The given diagram shows a blood capillary in close contact with structure Y. The relative concentration (in units) of carbon dioxide (CO2) and oxygen (O2) are given at three different sites.
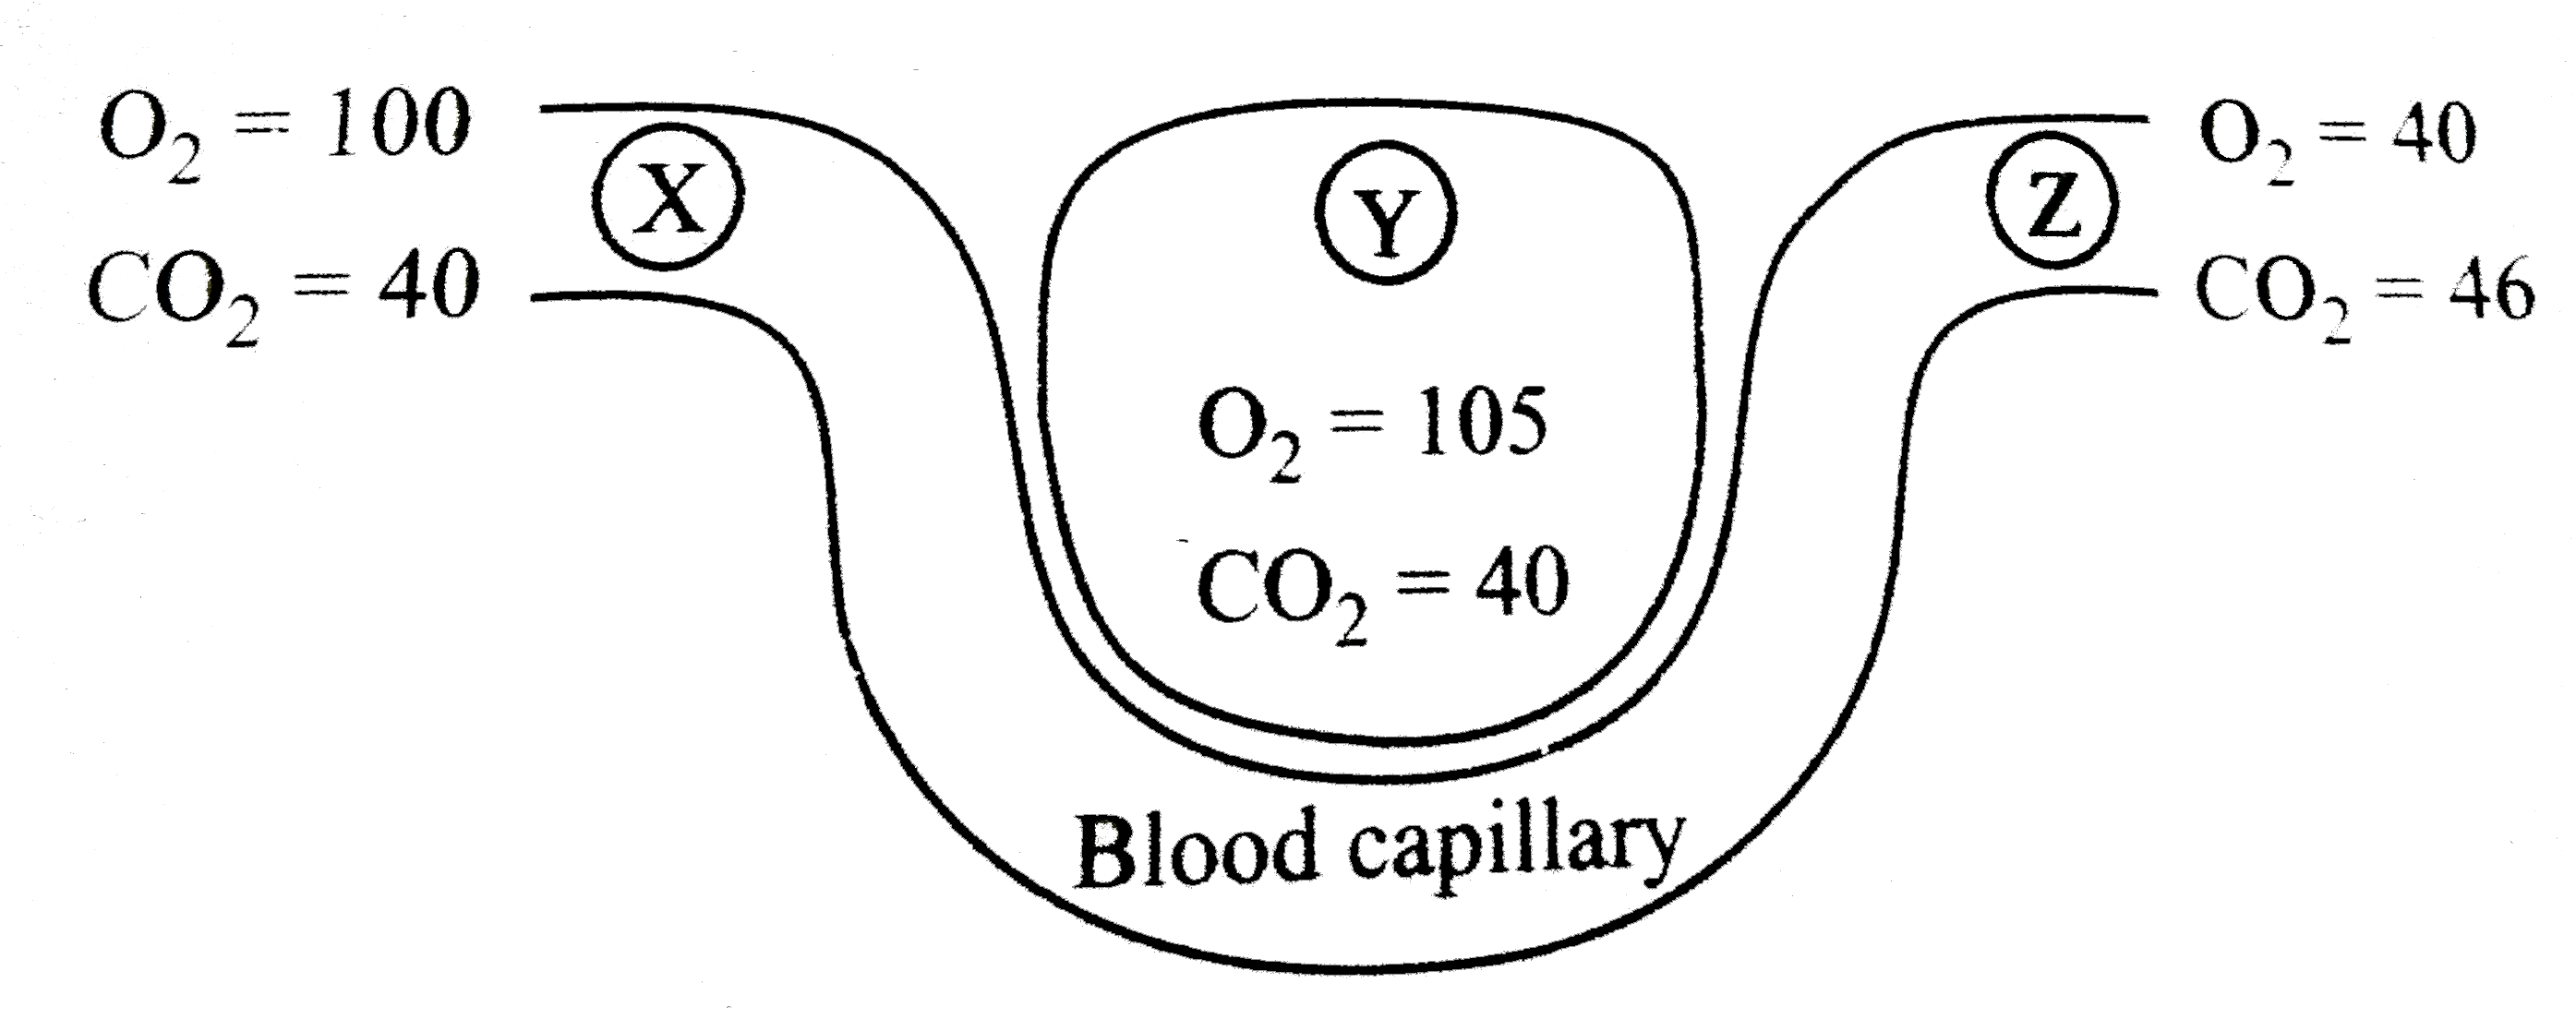
Which of the following statements is correct ?Aa) Y is an alveolus and blood flow is from X to ZBb) Y is an alveolus and blood flow is Z to XCc) Y is a muscle and blood flow is from X to ZDd) Y is a muscle and blood flow is from Z to X
(a) Explain, using a suitable diagram, how unpolarized light gets linearly polarized by scattering.
(b) Describe briefly the variation of the intensity of transmitted light when a polaroid sheet kept between two crossed polaroids is rotated. Draw the graph depicting the variation of intensity with the angle of rotation. How many maxima and minima would be observed when θ vaeries from 0 to π ?
View SolutionThin films, including soap bubbles and oil show patterns of alternative dark and bright regions resulting from interference among the reflected ligth waves. If two waves are in phase, their crests and troughs will coincide. The interference will be cosntructive and the amlitude of resultant wave will be greater then either of constituent waves. If the two wave are not of phase by half a wavelength (180∘), the crests of one wave will coincide width the troughs of the other wave. The interference will be destructive and the ampliutde of the resultant wave will be less than that of either consituent wave.
1. When incident light I, reaches the surface at point a, some of the ligth is reflected as ray Ra and some is refracted following the path ab to the back of the film.
2. At point b, some of the light is refracted out of the film and part is reflected back through the film along path bc. At point c, some of the light is reflected back into the film and part is reflected out of the film as ray Rc.
Ra and Rc are parallel. However, Rc has travelled the extra distance within the film fo abc. If the angle of incidence is small, then abc is approxmately twice the film's thickness .
If Ra and Rc are in phase, they will undergo constructive interference and the region ac will be bright. If Ra and Rc are out of phase, they will undergo destructive interference and the region ac will be dark.
I. Refraction at an interface never changes the phase of the wave.
II. For reflection at the interfere between two media 1 and 2, if n1>n2, the reflected wave will change phase. If n1<n2, the reflected wave will not undergo a phase change.
For reference, nair=1.00.
III. If the waves are in phase after reflection at all intensities, then the effects of path length in the film are:
Constrictive interference occurs when 2t=mλ/n,m=0,1,2,3,...
Destrcutive interference occurs when 2t=(m+12)λn,
m=0,1,2,3,...
If the waves are 180∘ out of the phase after reflection at all interference, then the effects of path length in the film ara:
Constructive interference occurs when
2t=(m+12)λn,m=0,1,2,3,...
Destructive interference occurs when
2t=mλn,m=0,1,2,3,...
The average human eye sees colors with wavelength between 430 nm to 680 nm. For what visible wavelength (s) will a 350 nm thick (n=1.35) soap film produce maximum destructive interference?
View Solution(i) Write a balanced chemical equation for process of photosynthesis. (ii)When do desert plants take up carbon dioxide and perform photosynthesis? Answer.
View SolutionWhat is meant by a linearly polarised light? Which type of waves can be polarised? Briefly explain a method for producing polarised light. Two polaroids are placed at 90∘ to each other and the intensity of transmitted light is zero. What will be the intensity of transmitted light when one more polaroid is placed between these two bisecting the angle between them ? Take intensity of unpolarised light as I0
View Solution(a) What is plane polarised light? Two polaroid sare placed at 90∘ to each other and the transmitted intensity is zero. What happens when one more polaroid is placed between these two, bisecting the angle between them? How will the intensity of transmitted light vary on further rotating the third polaroid?
(b) If a light beam shows no intensity variation when transmitted through a polaroid which is rotated, does it mean that the light is un-polarised? Explain briefly.
View Solution


