The graphic representation of interrelationship between plants and animals is
ecological niche
ecological pyramid
trophic level
none of these
The correct Answer is:B
Step-by-Step Solution:
1. Understanding the Question: The question asks for the graphic representation of the interrelationship between plants and animals. This means we are looking for a visual tool that illustrates how plants and animals interact within an ecosystem.
2. Analyzing the Options:
- Option 1: Ecological Niche: An ecological niche refers to the role or function of an organism within its environment, including its habitat and its interactions with other organisms. However, it does not serve as a graphic representation, so this option is not correct.
- Option 2: Ecological Pyramid: An ecological pyramid visually represents the different levels of organisms in an ecosystem, starting with producers (plants) at the base, followed by herbivores, primary carnivores, and so on. This option effectively shows the interrelationship between plants and animals, making it a strong candidate.
- Option 3: Trophic Level: Trophic levels indicate the position of an organism in a food chain or food web. While it relates to energy transfer, it does not provide a graphic representation by itself, so this option is also not correct.
3. Conclusion: After analyzing all the options, the ecological pyramid is the correct answer as it graphically represents the interrelationship between plants (producers) and animals (consumers) in an ecosystem.
Final Answer: The graphic representation of interrelationship between plants and animals is the Ecological Pyramid.
---
- Option 1: Ecological Niche: An ecological niche refers to the role or function of an organism within its environment, including its habitat and its interactions with other organisms. However, it does not serve as a graphic representation, so this option is not correct.
- Option 2: Ecological Pyramid: An ecological pyramid visually represents the different levels of organisms in an ecosystem, starting with producers (plants) at the base, followed by herbivores, primary carnivores, and so on. This option effectively shows the interrelationship between plants and animals, making it a strong candidate.
- Option 3: Trophic Level: Trophic levels indicate the position of an organism in a food chain or food web. While it relates to energy transfer, it does not provide a graphic representation by itself, so this option is also not correct.
Topper's Solved these Questions
Similar Questions
Food web is constituted by
(a) relationship between the organisms and the environment.
(b) relationship between plants and animals
(c) various interlinked food chains in an ecosysystem
(d) relationship between animals and environment.
View SolutionDifferentiate between Plant cells and animal cells
View Solution
Knowledge Check
The true graphical representation of volume versus temperature relationship at constant pressure is :
A B
B C
C D
D
Enumerate two differences between plant and animal cells.
View SolutionGive a graphic representation of the C3 cycle.
View SolutionScientist who defined ecology as the study of interrelationships between organisms and their environment is
View SolutionMention at least four differences between plant cells and animal cells.
View SolutionWhy is preservation of wild varieties of plants and animals necessary?
View SolutionGive a graphical representation of the C4 cycle.
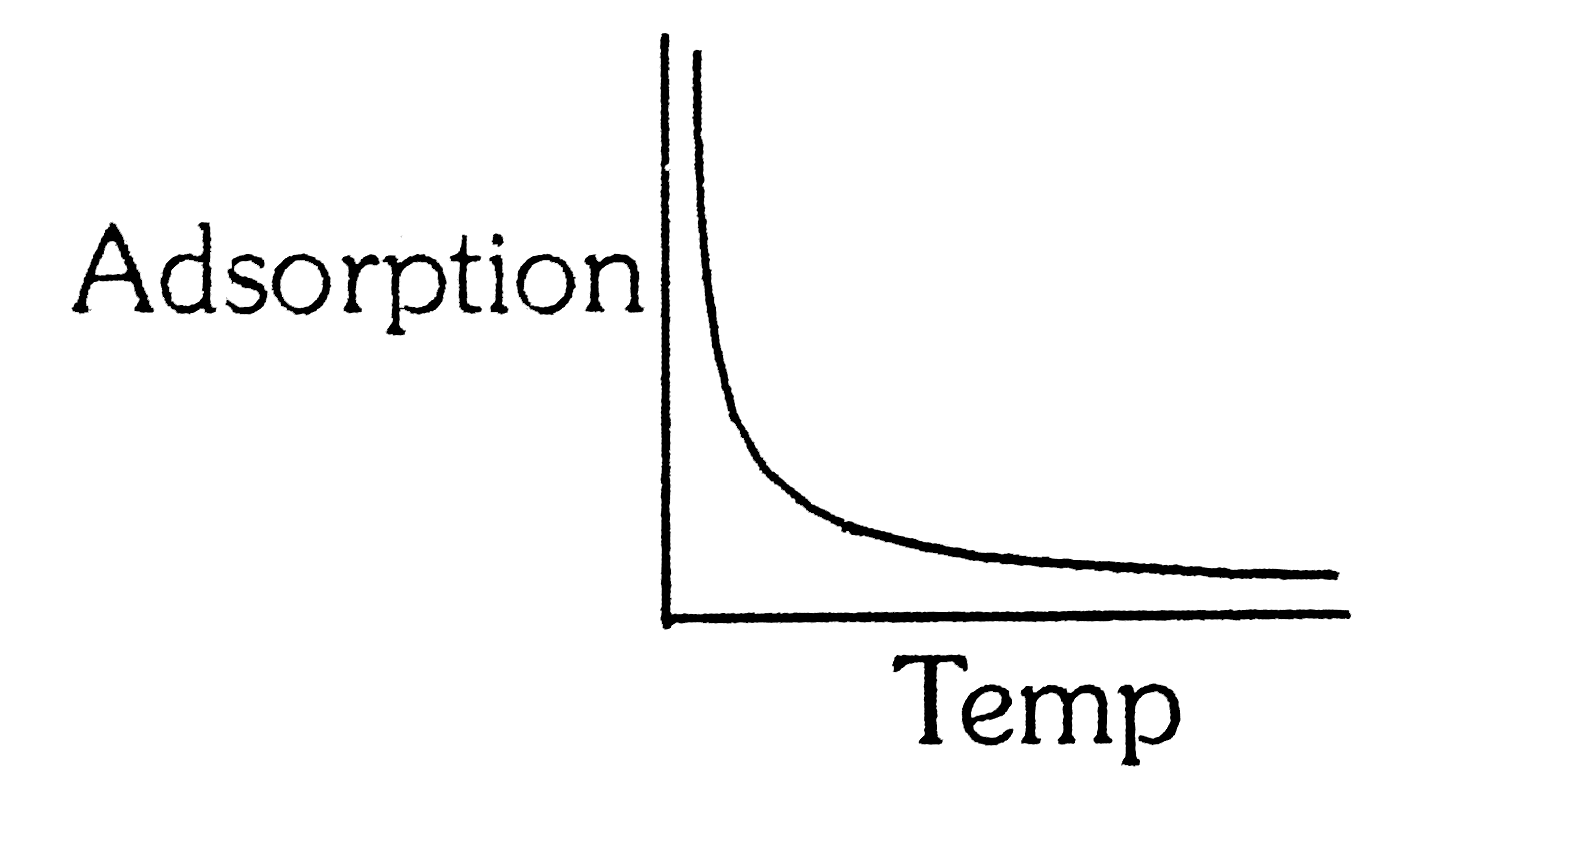
View SolutionAssertion :- The graphical representation of physical adsorption with temp is

Reason :- This is weak adsorption & adsorption is exothermic process.
View Solution
