The given graph is showing the relationship between the rate of enzyme reaction and concentration of substrate. At concentration of substrate greater than X, the
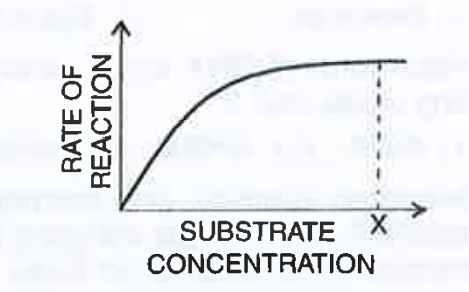
rate of reaction is limited by the enzyme concentration
substrate has an inhibitory effect
rate of reaction tends towards zero
product of the reaction has an inhibitory effect.
The correct Answer is:A
Step by step video & image solution for The given graph is showing the relationship between the rate of enzyme reaction and concentration of substrate. At concentration of substrate greater than X, the by Biology experts to help you in doubts & scoring excellent marks in Class 11 exams.
Updated on:21/07/2023Topper's Solved these Questions
- ANIMAL TISSUES BOOK - TRUEMEN BIOLOGY ENGLISHCHAPTER - ANIMAL TISSUES EXERCISE - MULTIPLE CHOICE QUESTIONS
193 Videos
- CELL- THE BASIC UNIT OF LIFE ( CELL AND ITS STRUCTURAL ORGANISATION )BOOK - TRUEMEN BIOLOGY ENGLISHCHAPTER - CELL- THE BASIC UNIT OF LIFE ( CELL AND ITS STRUCTURAL ORGANISATION )EXERCISE - MULTIPLE CHOICE ANSWER TYPE
308 Videos
Similar Questions
Knowledge Check
Which of the following graphs shows the relationship between the rate of an enzymatic activity and substrate concentration (S) ?
A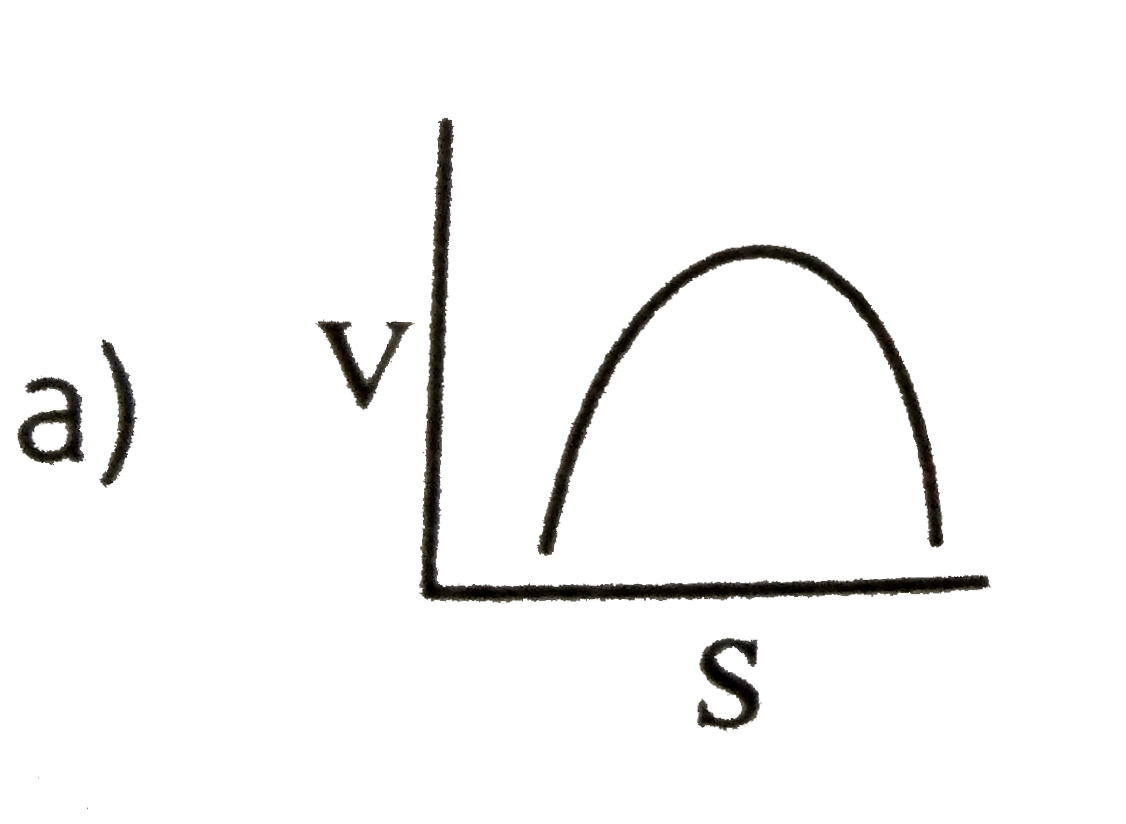 B
B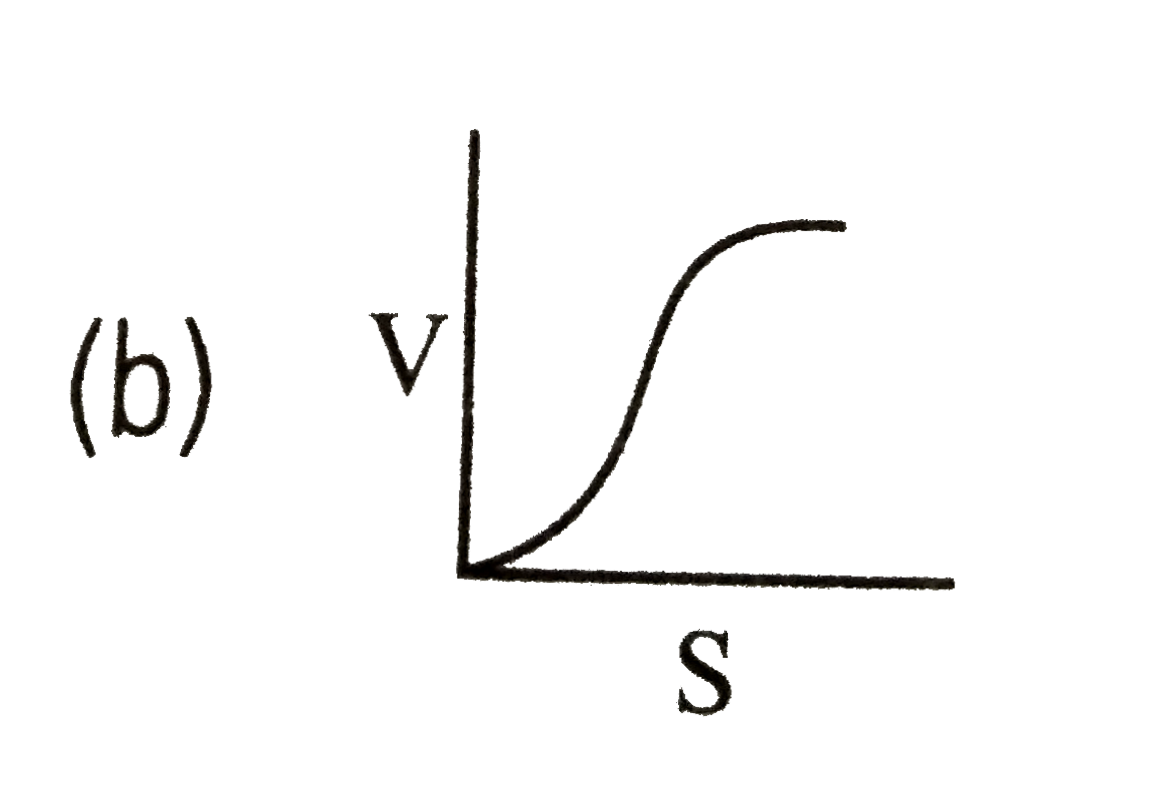 C
C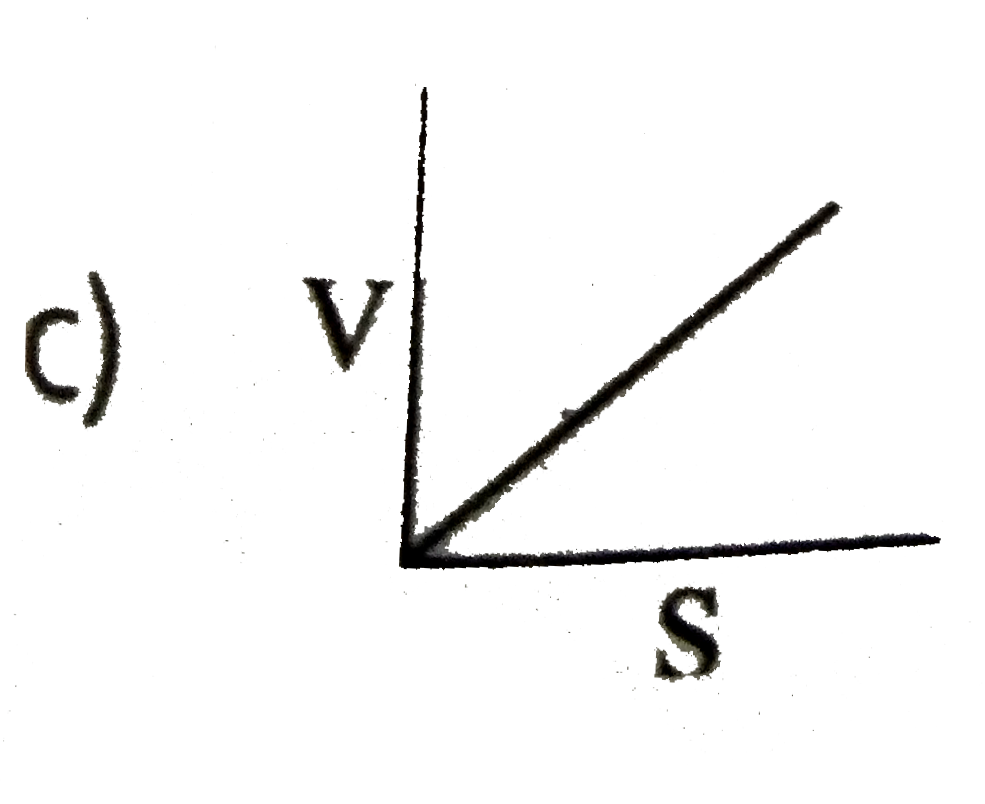 D
D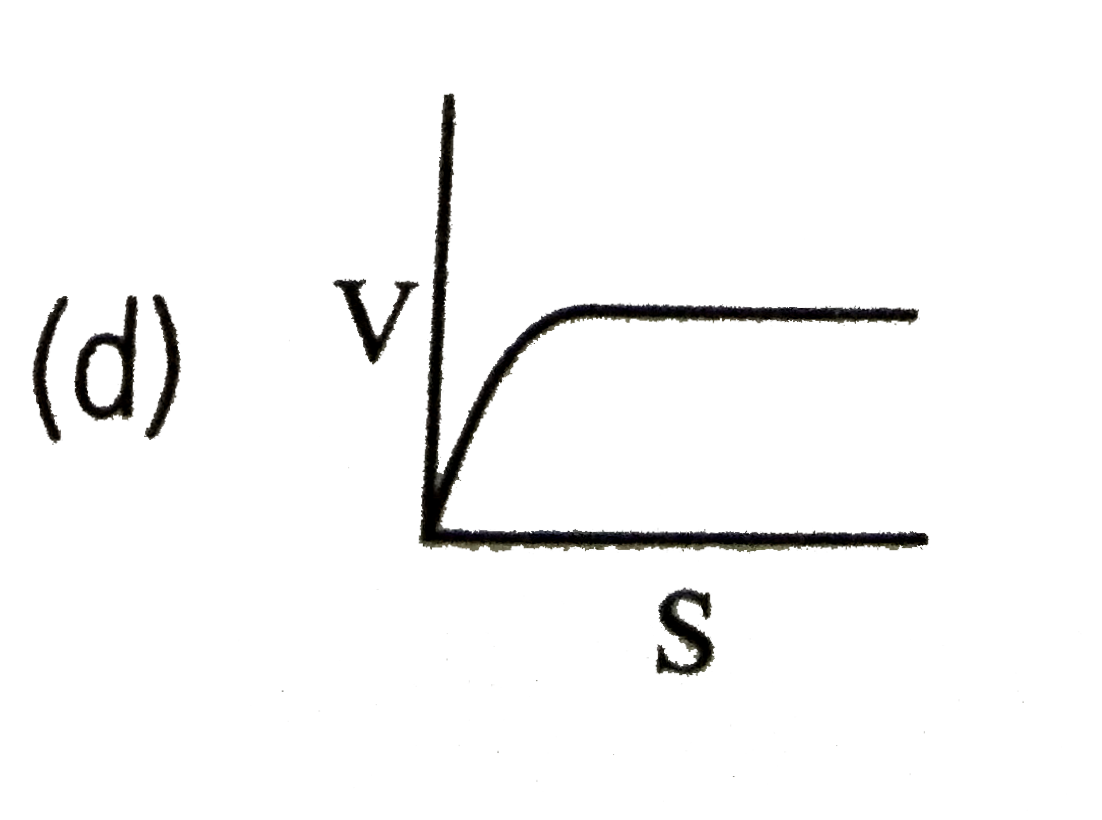
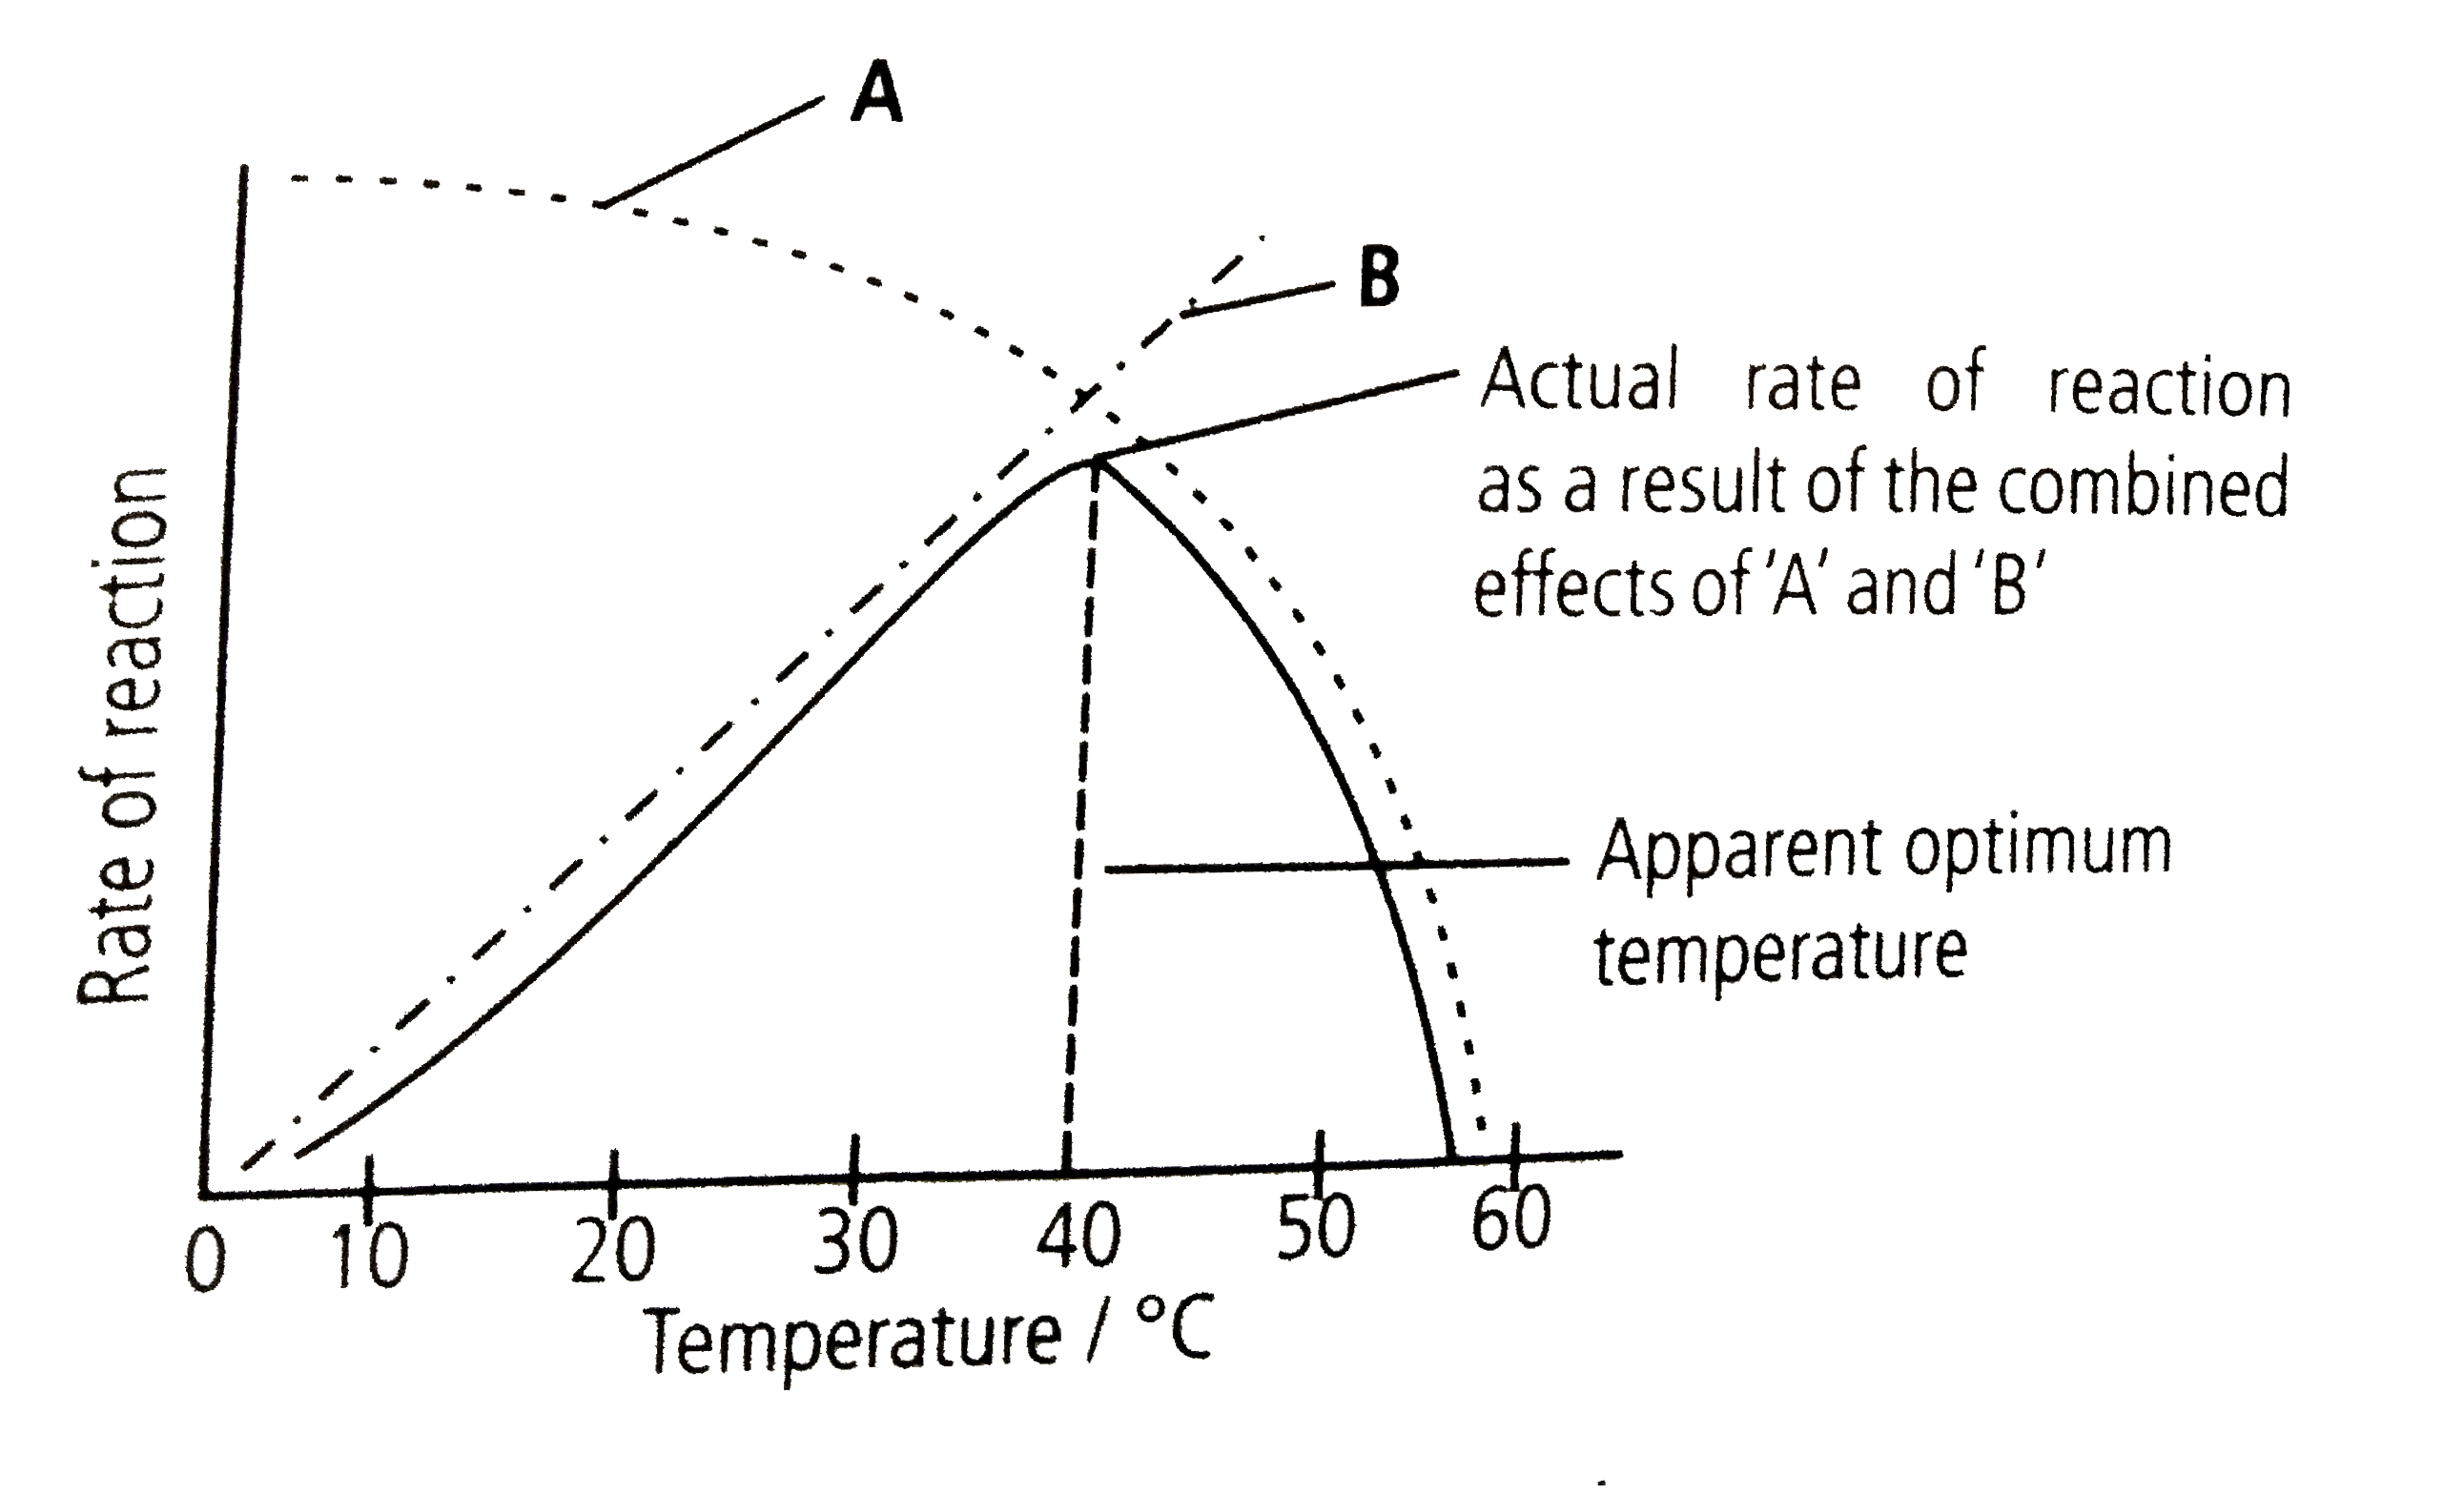
Refer to the given graph showing relationship between temperature and enzyme action.
Select the correct statement regarding 'A' and 'B'.
(i) 'A' shows the rate at which reaction decreases due to denaturation of enzyme molecules.
(ii) 'B' shows rate at which reaction increases due to decreased kinetic energy of substrate.
(iii) As temperature rises, more and more enzyme molecules are denatured and 'A' appears to fall.
(iv) 'B' shows rate at which reaction increases due to increased kinetic energy of substrate and enzyme molecules.
 A(i),(iii) and (iv)B(iii) onlyC(iii) and (iv) onlyD(i) and (ii) only
How does the enzymatic reactions change with substrate concentrates?
View SolutionAmong the statement given below, which statements /s is / are correct regarding the relationship between enzyme and substrate ?
I. Above a certain concentration of substrate , an enzyme reaches its maximum rate of reaction
II. Increasing the substrate concentration to a higher level doesn't reverse the effects of a competitive inhibitor.
III At high substrate concentration , a non competitive inhibitor no longer affects the enzyme activity .
IV. The higher the concentration of substrate the faster an enzyme can cataylse a reaction.
View SolutionSubstrate that show E1 reaction
View SolutionWith the increase of substrate the rate of reaction will go on increasing.
View SolutionIf pH and temperature are kept constant, does the rate of reaction keep increasing with increase in substrate concentration?
View SolutionWhat would be the effect on the rate of reaction between an inhibitor like arsenic and the substrate if substrate concentration is increased?
View Solution
