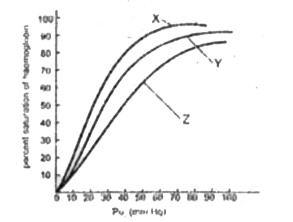
The oxygen - haemoglobin dissociation curve will show a right shift in case of
High pCO2
High pCO2
Low pCO2
Less H+ concentration
The correct Answer is:b
To solve the question regarding the oxygen-hemoglobin dissociation curve and its right shift, we can follow these steps:
1. Understanding the Oxygen-Hemoglobin Dissociation Curve:
- The oxygen-hemoglobin dissociation curve illustrates how readily hemoglobin binds to oxygen at various partial pressures of oxygen (pO2). It typically has a sigmoid shape.
2. Identifying Factors Affecting the Curve:
- The position of the curve can shift to the right or left based on several physiological factors, including:
- pH levels (acidity or alkalinity)
- Temperature
- Partial pressure of carbon dioxide (pCO2)
- Concentration of 2,3-bisphosphoglycerate (2,3-BPG)
3. Right Shift of the Curve:
- A right shift in the curve indicates that hemoglobin has a decreased affinity for oxygen, meaning it releases oxygen more readily to the tissues. This shift can occur under certain conditions:
- Increased levels of carbon dioxide (high pCO2)
- Decreased pH (more acidic conditions)
- Increased temperature
4. Analyzing the Given Options:
- The question provides options regarding the conditions under which the curve will shift to the right:
- High partial pressure of carbon dioxide
- Low partial pressure of carbon dioxide
- Least hydrogen concentration
5. Selecting the Correct Answer:
- Out of the given options, the correct answer is high partial pressure of carbon dioxide. This condition leads to a right shift in the oxygen-hemoglobin dissociation curve, promoting oxygen release to tissues.
Final Answer:
The oxygen-hemoglobin dissociation curve will show a right shift in case of high partial pressure of carbon dioxide.
---
- The oxygen-hemoglobin dissociation curve illustrates how readily hemoglobin binds to oxygen at various partial pressures of oxygen (pO2). It typically has a sigmoid shape.
- The position of the curve can shift to the right or left based on several physiological factors, including:
- pH levels (acidity or alkalinity)
- Temperature
- Partial pressure of carbon dioxide (pCO2)
- Concentration of 2,3-bisphosphoglycerate (2,3-BPG)
- A right shift in the curve indicates that hemoglobin has a decreased affinity for oxygen, meaning it releases oxygen more readily to the tissues. This shift can occur under certain conditions:
- Increased levels of carbon dioxide (high pCO2)
- Decreased pH (more acidic conditions)
- Increased temperature
- The question provides options regarding the conditions under which the curve will shift to the right:
- High partial pressure of carbon dioxide
- Low partial pressure of carbon dioxide
- Least hydrogen concentration
- Out of the given options, the correct answer is high partial pressure of carbon dioxide. This condition leads to a right shift in the oxygen-hemoglobin dissociation curve, promoting oxygen release to tissues.
The oxygen-hemoglobin dissociation curve will show a right shift in case of high partial pressure of carbon dioxide.
Topper's Solved these Questions
- NCERT Exemplar Questions +1 (BODY FLUIDS AND CIRCULATION) BOOK - TRUEMEN BIOLOGY ENGLISHCHAPTER - NCERT Exemplar Questions +1 (BODY FLUIDS AND CIRCULATION) EXERCISE - MCQs
16 Videos
- NCERT Exemplar Questions +1 (CELL CYCLE AND CELL DIVISION)BOOK - TRUEMEN BIOLOGY ENGLISHCHAPTER - NCERT Exemplar Questions +1 (CELL CYCLE AND CELL DIVISION)EXERCISE - MCQs
10 Videos
Similar Questions
Knowledge Check
The oxygen dissociation curve will show a right shift in case of:
Ahigh PCO2Bhigh PO2Clow PCO2Dless H+ concentrationThe oxygen dissociation curve is
AparabolaBslopeCsigmoidDstright line.
O2 dissociation curve is:
View SolutionDissociation curve shifts to the right when
View SolutionGo through the following statements
(i) the peripheral chemoreceptors for regulation of respiration are located in carotid veins and arch of aorta
(ii) the primary effect of pneumotaxic centre is to control the switch off point of inspiratory signal and thus limit inspiraton
(iii) the chemosensitve area for brain for respiratory control is highly sensitive to O2 concentration
(iv) In case of fetal haemoglobin the oxygen haemoglobin dissociation curve is shifted toward left
which of these are correct ?
(a) i, ii & iv
(b) ii and iv
(c) ii, iii & iv
(d) iii and iv
View SolutionThe dissociation curve is associated with
View SolutionThe following oxygen-haemoglobin dissociation curves explain the effect of pH on oxygen-affinity of haemoglobin. Find out option that gives the correct descending order of pH for X, Y and Z.

View SolutionRight-shift of oxygen-haemoglobin dissociation curve can occur due to
View Solution
