The UN Conference of Parties on climate change in the year 2012 was held at:
Warsaw
Durban
Doha
Lima
To solve the question regarding the location of the UN Conference of Parties on climate change in 2012, we can follow these steps:
1. Identify the Event: The question asks about the UN Conference of Parties (COP) on climate change that occurred in 2012.
2. Recall the Options: The options provided are Warsaw, Durban, Doha, and Lima.
3. Research the Event: The COP meetings are held annually, and each meeting is hosted by a different country. The specific COP meeting in question is COP 18.
4. Determine the Location: COP 18 was held from November 26 to December 8, 2012.
5. Confirm the Venue: The conference took place at the Qatar National Convention Center, which is located in Doha, Qatar.
6. Conclude the Answer: Based on the information gathered, the correct answer to the question is Doha.
Final Answer:
The UN Conference of Parties on climate change in the year 2012 was held at Doha.
---
The UN Conference of Parties on climate change in the year 2012 was held at Doha.
Topper's Solved these Questions
Similar Questions
Knowledge Check
According to the U.S Department of Labor, the unemployment rate in January of 2012 in the United States was 8.3%. According to the same department, the unemployment rate in January of 2016 was 4.9% . According to the U.S department of Labor, how did the unemployment rate change from January 2012 to January 2016?
AIt decreased by 79%BIf decreased by 41%CIt decreased by 34%DIt increased by 41%
The UN Conference of Parties on Climate Change in the year 2011 was held in
View SolutionThe UN Conference of Parties on climate in the year 2011 was held in:
View SolutionThe UN Conference of Parties on climate in the year 2011 was held in:
View SolutionThe COP-24 on climate change in the year 2018 was held at
(a) Kyoto, Japan
(b) Rio de Janeiro, Brazil
(c) Katowice, Poland
(d) Doha, Qatar
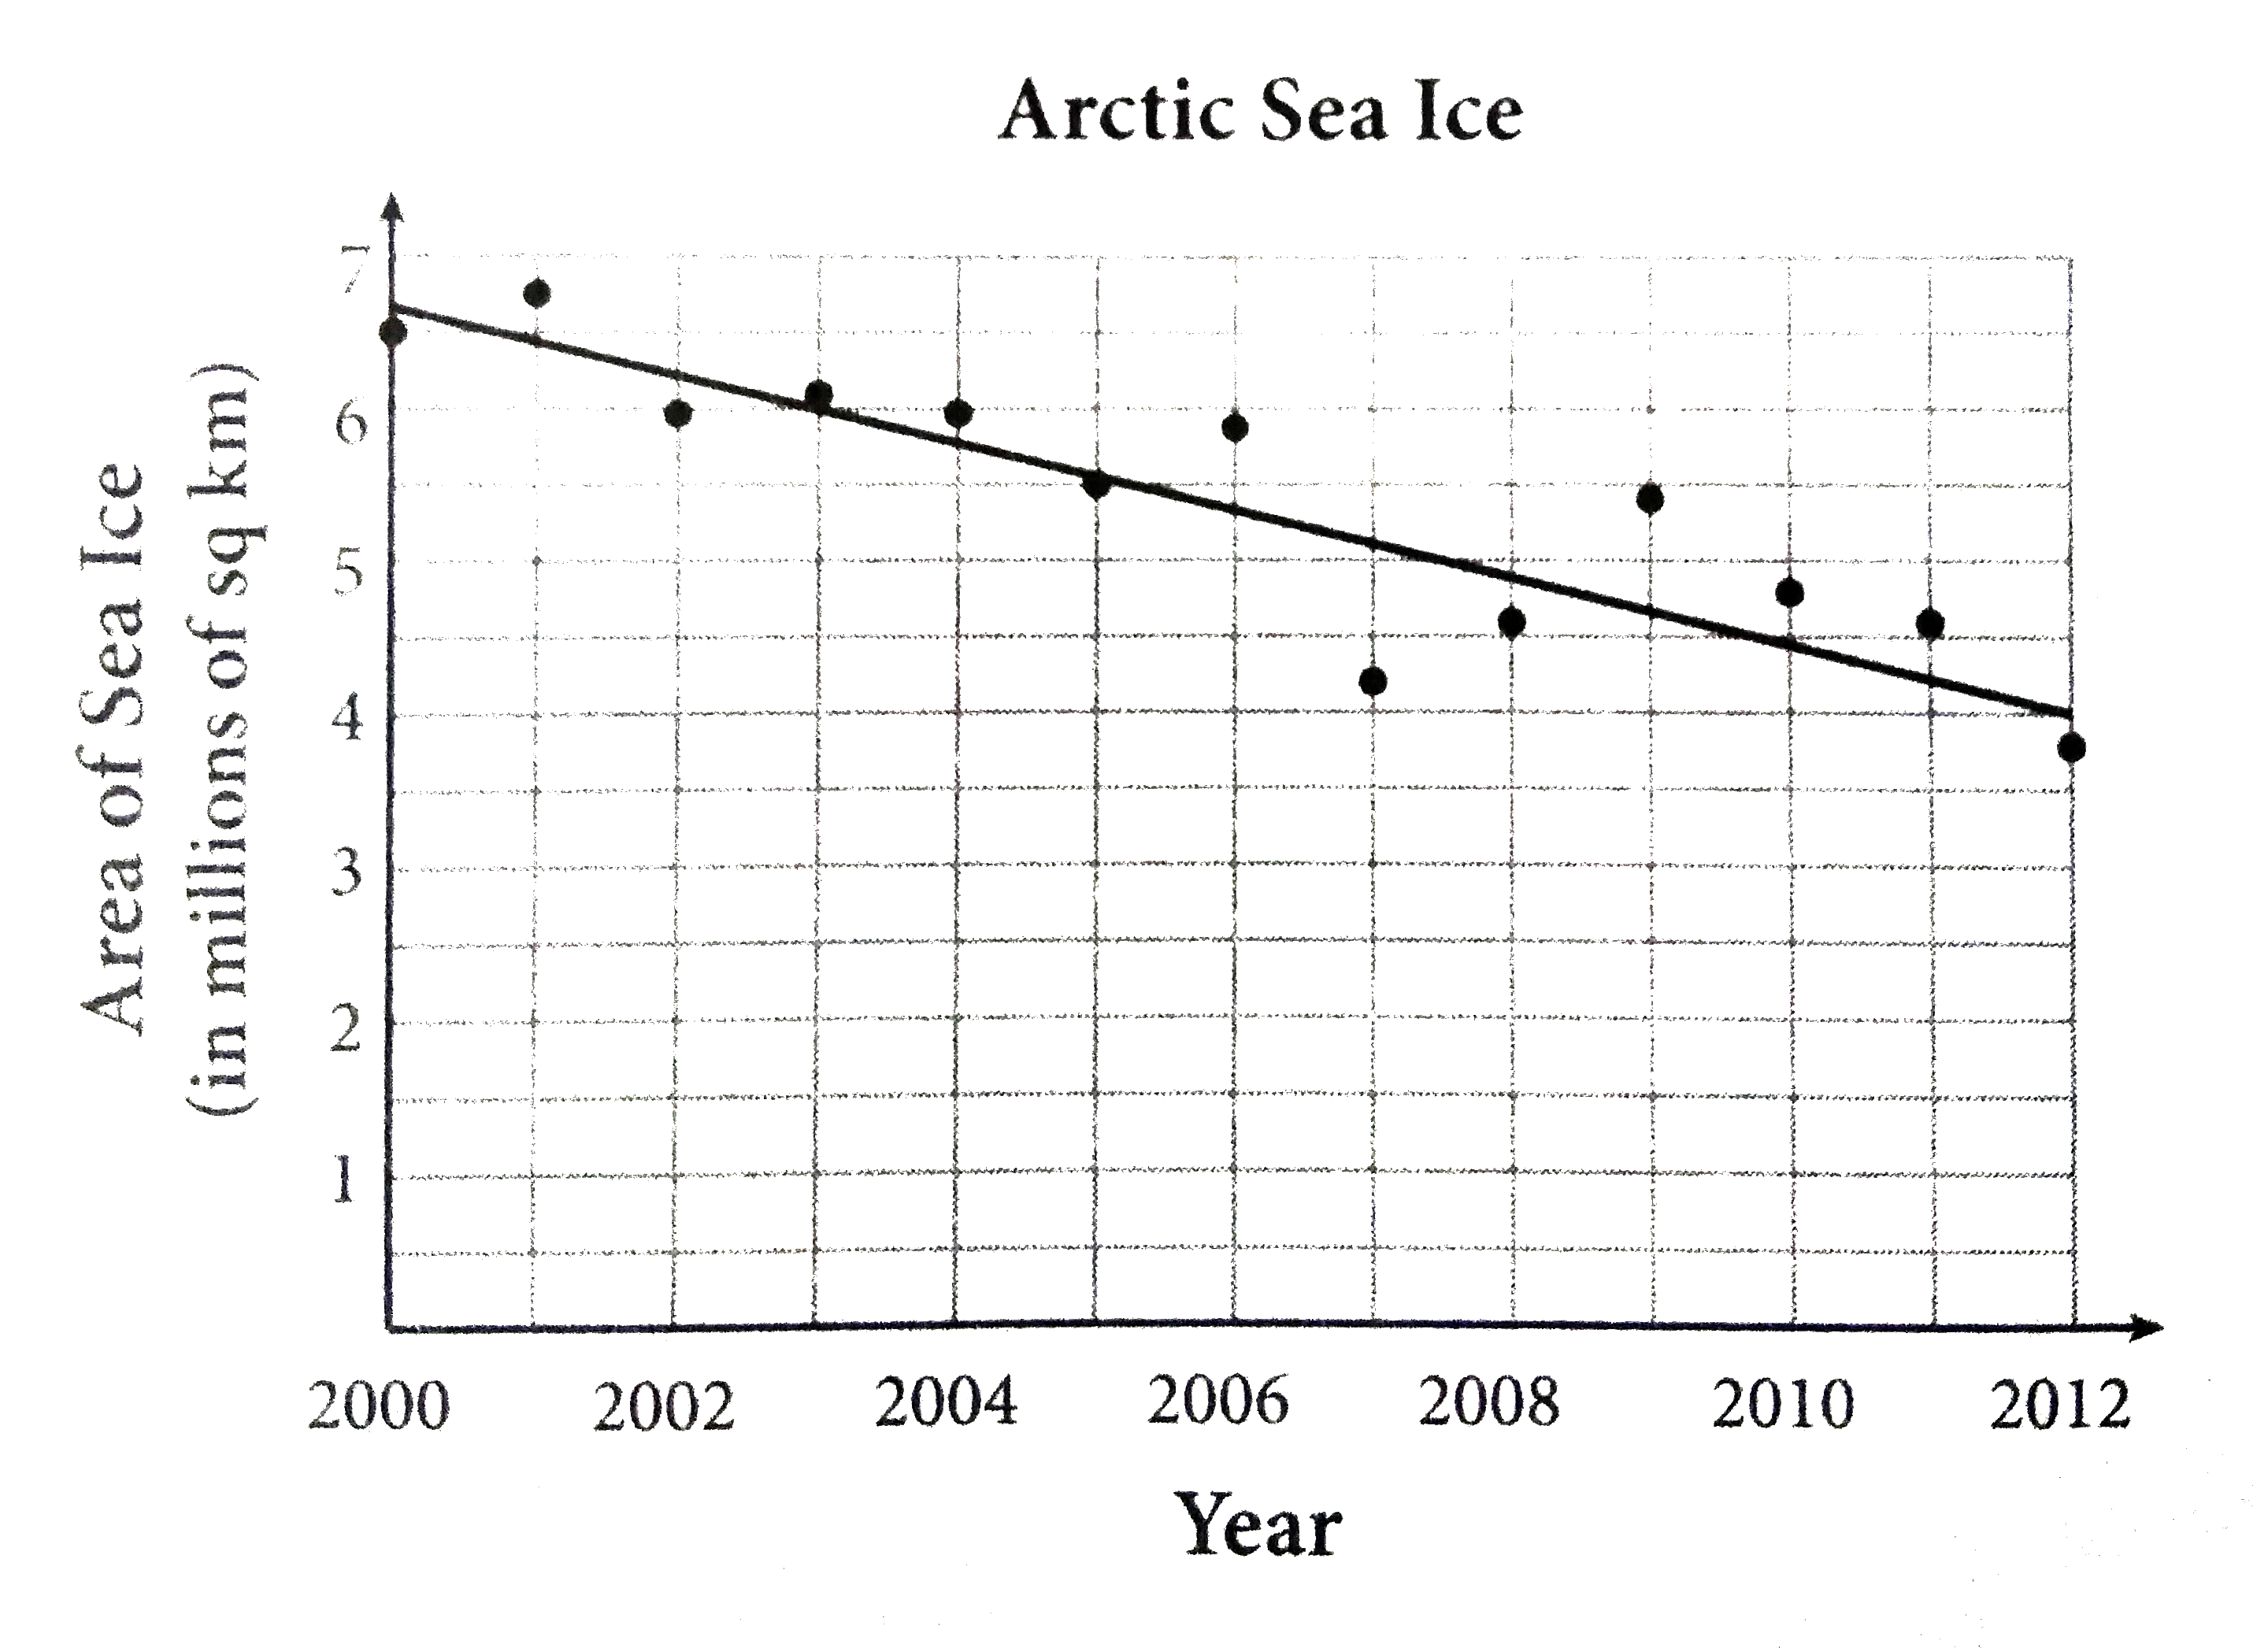
View SolutionSea ice extent is a measurement of the area of ocean with at least 15% sea ice. The graph below shows data for the extent of Artic sea ice between 2000 and 2012 as reported by the National Snow and Ice Data Center. The line of best fit is also shown. The equations of the line is A(t)=−0.187t+380.5, where A(t) represents the area of measurement sea ice in the Artic Ocean in the year t.

Q. Assuming the trend of the data continues in what year will the measurable sea ice in the Arctic Ocean cease to exist?
View SolutionQuestion 37 and 38 refer to the following information
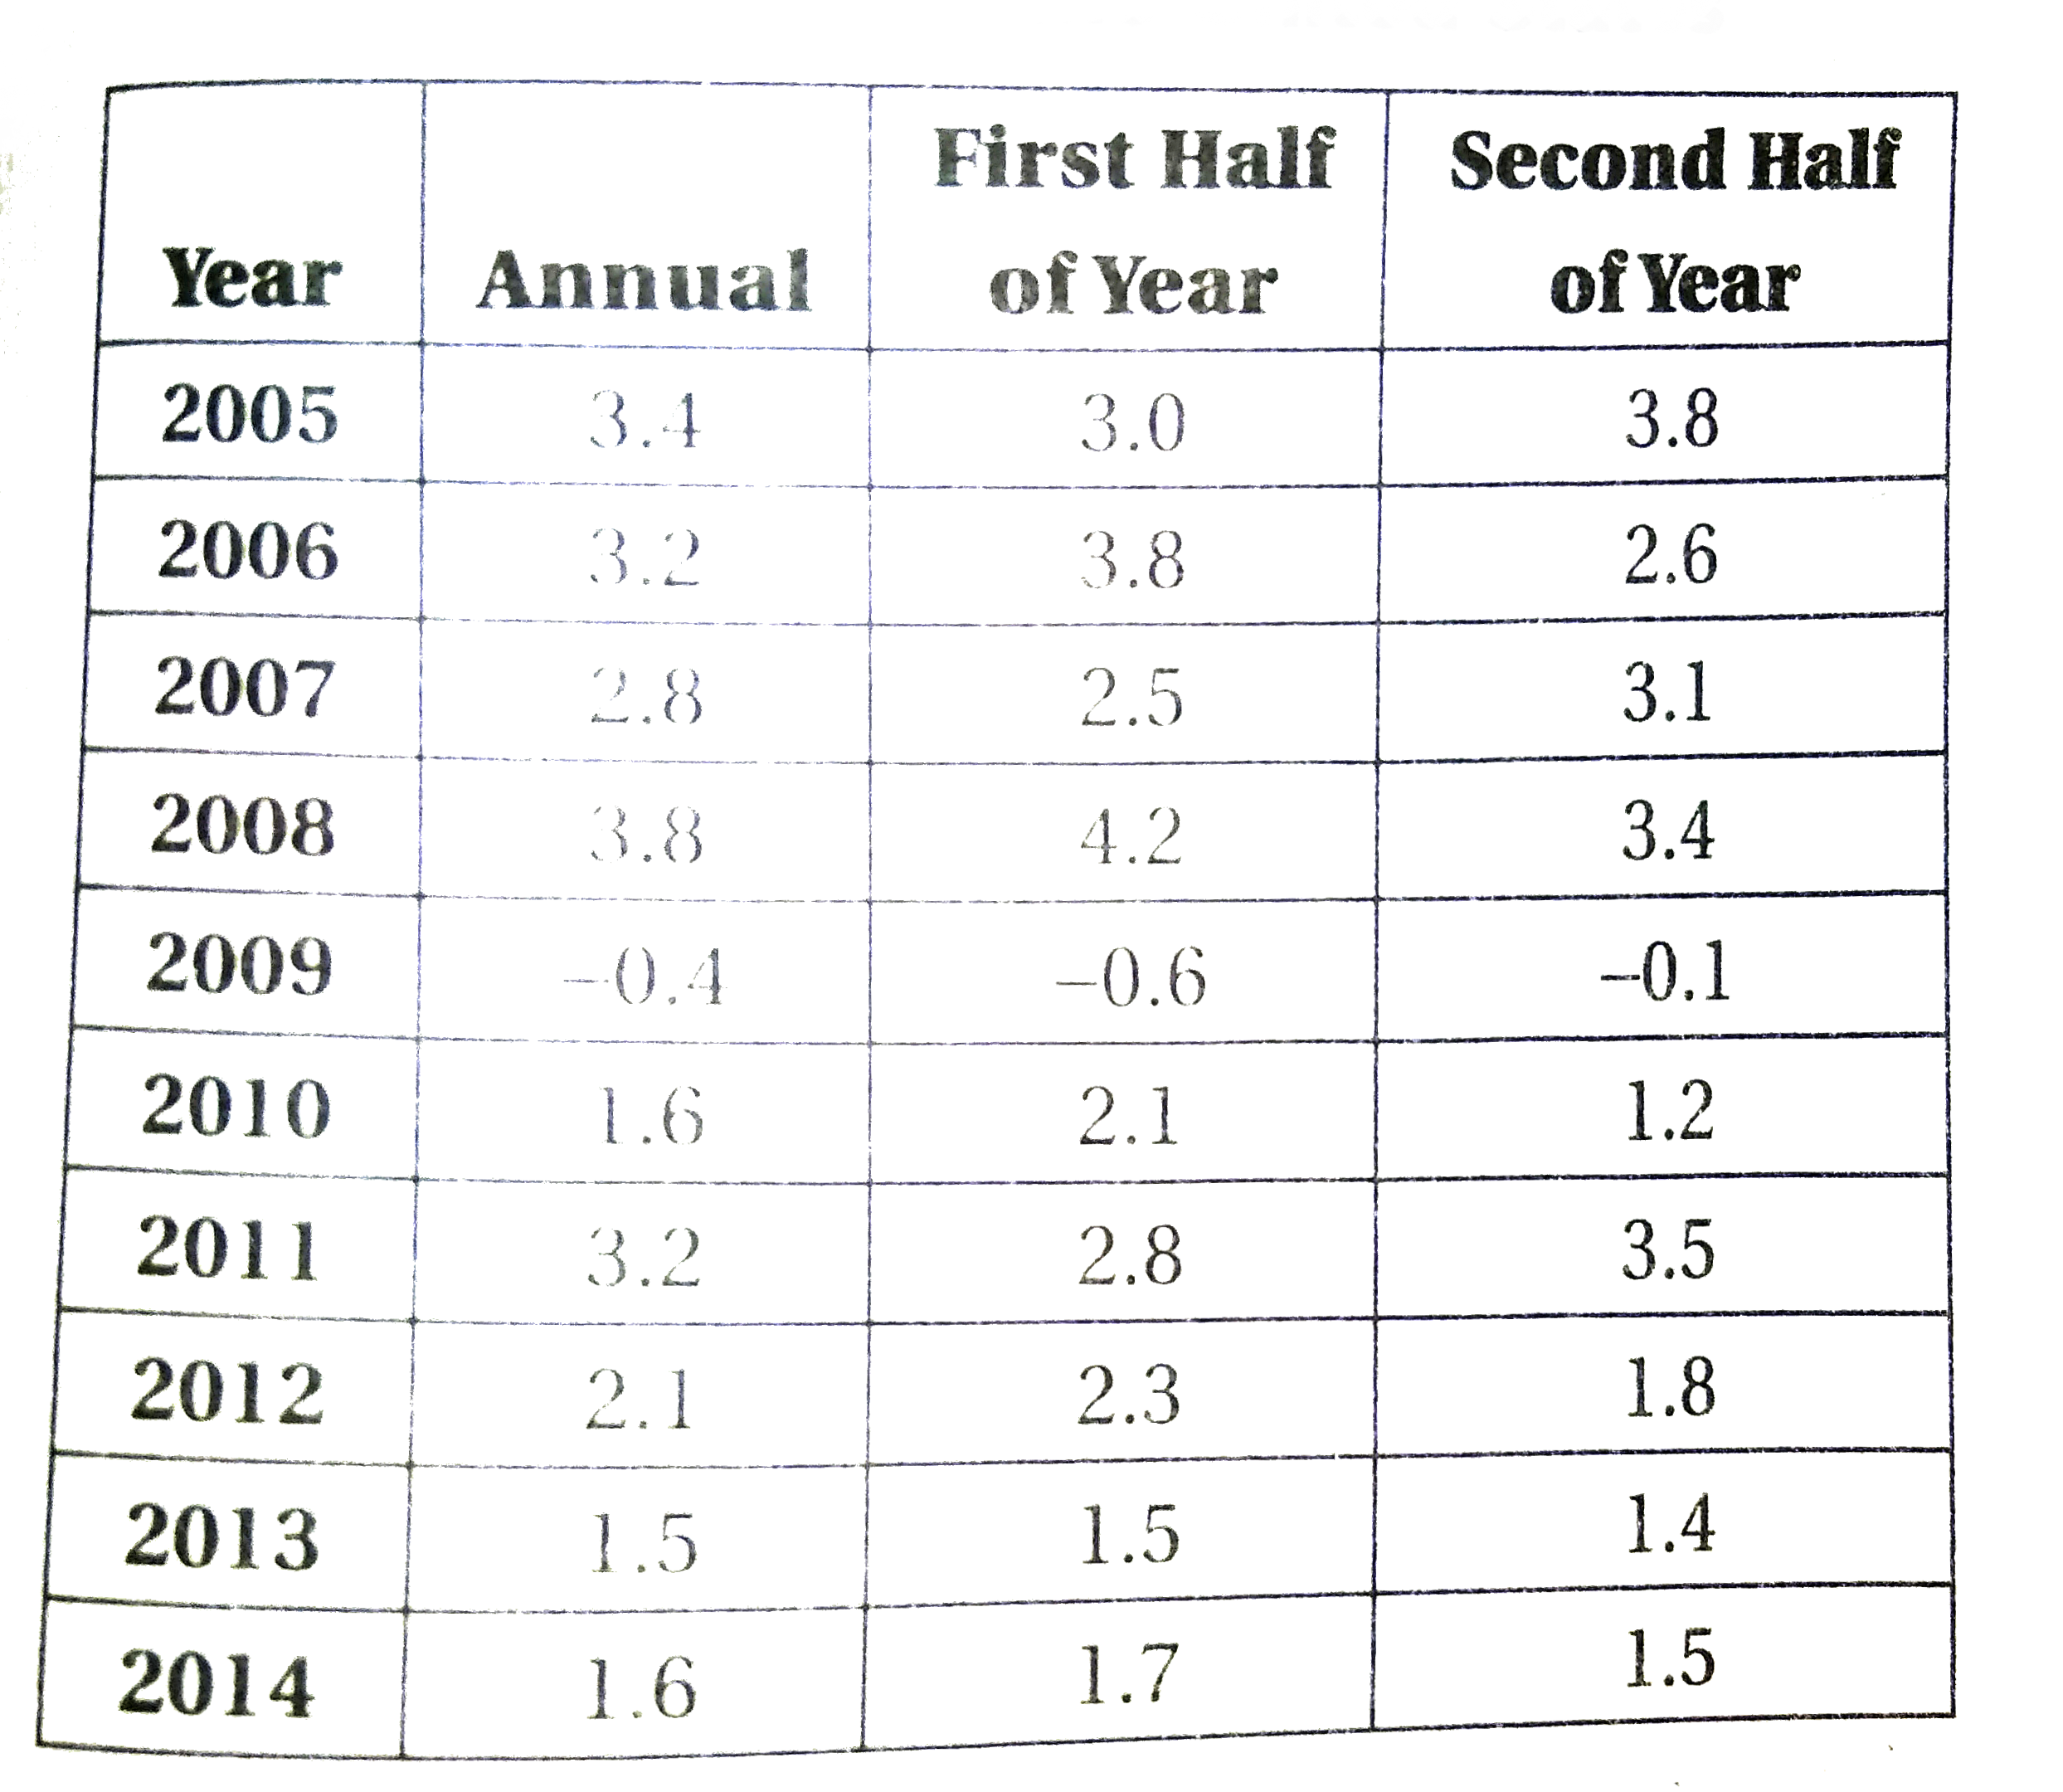
The U.S. federal Government tracks the Consumer Price Index (CPI)- a comprehensive standard used to estimate the average price change for the typical goods and services purchased by consumers. This measure gives economics a useful way to estimate the rates of the inflation or deflation, which reflects the respective general increase or decrease of prices of goods and services in the economy. The accompanying tables summarizes the changes in the CPI for the years 2005 through 2014, which can be assumed to be the corresponding percent rates of inflation.

Q. An economist purchases a kitchen applience at the beginning of 2014 for $3,000. The sales person advises him that the only changes in prices for the applience since the beginning of 2012 have been due to inflation. Assuming that is the case, what would have been the purchase price for the applience at the beginning of 2012 correct to the nearest dollars?
View SolutionIf there are two communities A and B of plants. In the year 2010 there was a similar natural disturbance in both the communities . Depending on the given data choose how mnay are the correct statements ?
(i) A and B are equally stable.
(ii) A has more species than B.
(iii) A and B have equal diversity of species
(vi) B is more stable than A
YearYearYearYear2009201020112012BiomassA=1000A=800A=950A=1000(Total)UnitsUnitsUnitsUnitsB=1000B=100B=500B=100UnitsUnitsUnitsUnits
View Solution